
Aggregate Gradation Chart – ASTM C33 Sieve Analysis & Grading Limits
Aggregate Gradation Chart
ASTM C33 Sieve Analysis & Grading Limits
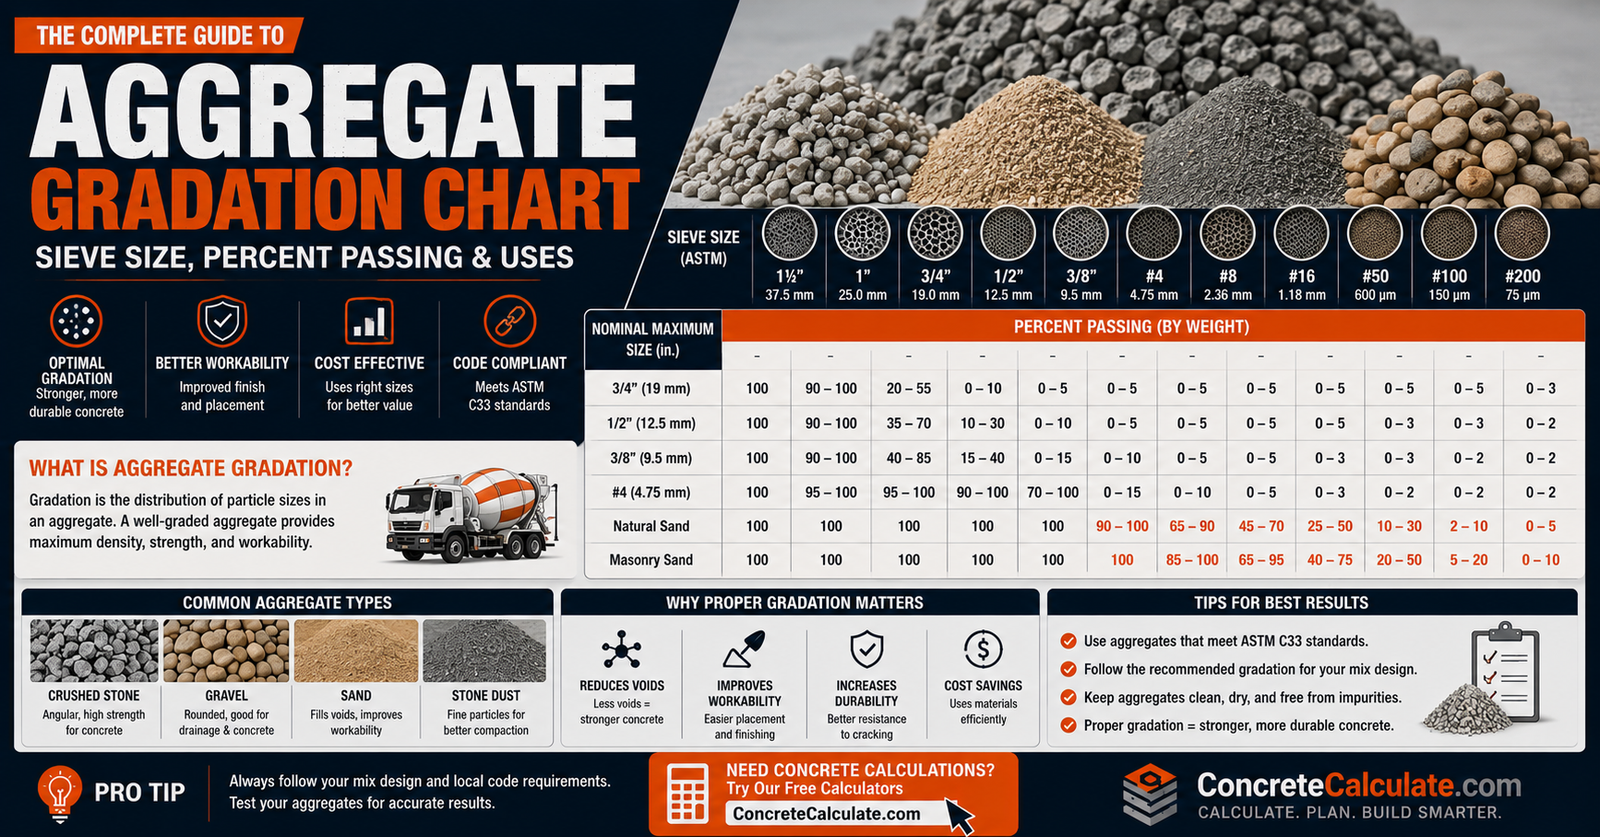
Aggregate gradation describes the full distribution of particle sizes in a sample, not just its nominal size. This chart provides verified ASTM C33 fine and coarse aggregate grading limits, sieve conversions, gradation types and combined-blend calculation.
 Reviewed by Muhammad Ramzan Babar, PhD Researcher & Calculator Developer · View Profile
Aggregate size describes the nominal or maximum particle size of a material. Aggregate gradation describes what percentage of the sample falls within each size range across a full series of sieves. A material can share a nominal size with another material yet have a very different gradation curve. See the Aggregate Size Chart for nominal size reference.
⭐⭐⭐⭐⭐ Aggregate Gradation Chart: Quick Reference
ASTM C33 grading limits for fine aggregate and two of the most common coarse aggregate size numbers used in concrete.
Fine Aggregate (ASTM C33)
| Sieve | Opening (mm) | Percent Passing |
|---|---|---|
| 3/8 in | 9.5 | 100 |
| No. 4 | 4.75 | 95 to 100 |
| No. 8 | 2.36 | 80 to 100 |
| No. 16 | 1.18 | 50 to 85 |
| No. 30 | 0.600 | 25 to 60 |
| No. 50 | 0.300 | 5 to 30 |
| No. 100 | 0.150 | 0 to 10 |
Coarse Aggregate, ASTM C33 Size No. 57 and No. 67
| Sieve | No. 57 % Passing | No. 67 % Passing |
|---|---|---|
| 1 1/2 in | 100 | |
| 1 in | 95 to 100 | 100 |
| 3/4 in | 90 to 100 | |
| 1/2 in | 25 to 60 | |
| 3/8 in | 20 to 55 | |
| No. 4 | 0 to 10 | 0 to 10 |
| No. 8 | 0 to 5 | 0 to 5 |
These limits come directly from ASTM C33, Standard Specification for Concrete Aggregates, Table 1 (fine aggregate) and Table 2 (coarse aggregate size numbers). Coarse aggregate has no single universal gradation; each size number has its own set of sieve requirements. Full details for additional size numbers appear in the ASTM C33 Coarse Aggregate Size Numbers section below.
⭐⭐⭐⭐⭐ What Is Aggregate Gradation?
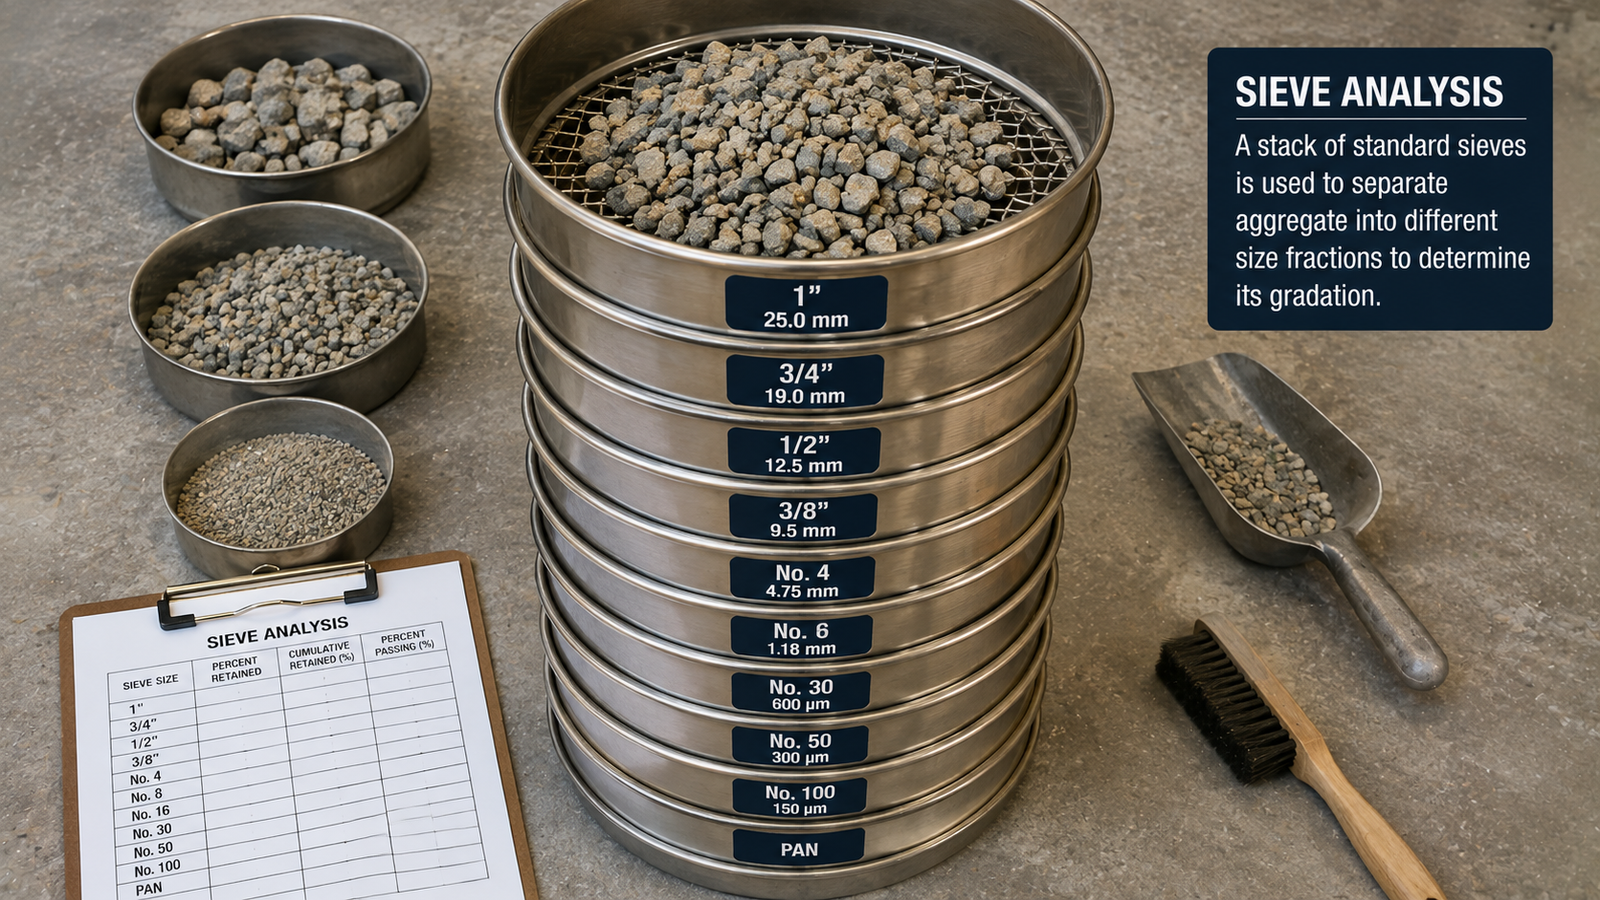
Aggregate gradation is the particle-size distribution of a sample, determined mainly through sieve analysis.
Particle-size distribution
Gradation describes what proportion of a sample’s particles fall into each size range, not just the largest or smallest particle present.
Sieve analysis
The standard test method for gradation passes a dried, weighed sample through a stack of sieves with progressively smaller openings.
Percent passing and percent retained
Results are expressed as the percentage of the sample passing each sieve, or the percentage retained on each sieve.
Gradation curve
Plotting percent passing against sieve size produces a gradation curve, the standard visual representation of a sample’s particle-size distribution.
Gradation is closely related to important engineering properties such as permeability, strength, workability, and frost susceptibility in various construction applications, which is why it receives its own set of specification limits separate from nominal aggregate size.
⭐⭐⭐⭐⭐ Aggregate Size vs Aggregate Gradation
This distinction is essential and should never be blurred together.
| Question | Answered By |
|---|---|
| What particle size or nominal size is this aggregate? | Aggregate Size Chart |
| What percentage of the aggregate falls within each particle-size range? | Aggregate Gradation Chart (this page) |
A material labeled with the same nominal size can still have a different distribution of particle sizes within it. Gradation is what determines void content, packing behavior, and many performance properties, not the nominal size label alone. See the Aggregate Size Chart for nominal particle size reference.
⭐⭐⭐⭐⭐ How Aggregate Gradation Is Reported
Standard test methods report gradation as percentage by dry weight passing each sieve.
Percent passing
The percentage of the total sample mass that passes through a given sieve opening.
Percent retained
The percentage of the total sample mass that remains on a specific sieve.
Cumulative percent retained
The running total of percent retained on a given sieve plus all coarser sieves above it.
Sieve opening vs particle size
Sieve opening is a standardized dimension; the particles retained on or passing a sieve can vary somewhat in actual dimension depending on particle shape.
⭐⭐⭐⭐⭐ Aggregate Sieve Size Chart
Standard U.S. sieve openings in inches and millimeters used in aggregate gradation testing.
| U.S. Sieve | Opening (in) | Opening (mm) |
|---|---|---|
| 3 in | 3.000 | 75.0 |
| 2 in | 2.000 | 50.0 |
| 1 1/2 in | 1.500 | 37.5 |
| 1 in | 1.000 | 25.0 |
| 3/4 in | 0.750 | 19.0 |
| 1/2 in | 0.500 | 12.5 |
| 3/8 in | 0.375 | 9.5 |
| No. 4 | 0.187 | 4.75 |
| No. 8 | 0.094 | 2.36 |
| No. 16 | 0.047 | 1.18 |
| No. 30 | 0.023 | 0.600 |
| No. 50 | 0.012 | 0.300 |
| No. 100 | 0.006 | 0.150 |
| No. 200 | 0.003 | 0.075 |
Sieve designations and openings conform to ASTM E11, Standard Specification for Woven Wire Test Sieve Cloth and Test Sieves, the standard referenced by ASTM C33 and other aggregate gradation test methods.
⭐⭐⭐⭐⭐ Fine Aggregate Gradation Chart
ASTM C33 grading limits for fine aggregate used in concrete.
| Sieve | Percent Passing |
|---|---|
| 3/8 in (9.5 mm) | 100 |
| No. 4 (4.75 mm) | 95 to 100 |
| No. 8 (2.36 mm) | 80 to 100 |
| No. 16 (1.18 mm) | 50 to 85 |
| No. 30 (600 µm) | 25 to 60 |
| No. 50 (300 µm) | 5 to 30 |
| No. 100 (150 µm) | 0 to 10 |
Beyond the percent passing limits above, ASTM C33 requires that fine aggregate have not more than 45 percent passing any one sieve and retained on the next consecutive sieve, and that the fineness modulus be not less than 2.3 nor more than 3.1. Both requirements must be satisfied together with the percent passing table.
⭐⭐⭐⭐⭐ Fine Aggregate Gradation Curve
Plotting the ASTM C33 fine aggregate limits produces an upper and lower boundary, forming an acceptable envelope.
Smooth curve
A gradation curve that rises smoothly across the sieve range generally indicates a continuous, well-distributed sample.
Missing fractions or excess fines
A curve with a sudden flat section or steep jump can indicate a missing intermediate size fraction or an excess of fine material.
Coarse sand vs fine sand
A curve running near the lower limit generally represents coarser sand, while a curve near the upper limit represents finer sand, both potentially still within specification.
⭐⭐⭐⭐⭐ Coarse Aggregate Gradation Chart
Coarse aggregate gradation is organized by ASTM size number rather than a single universal chart.
Unlike fine aggregate, which has one grading table, coarse aggregate under ASTM C33 has multiple size numbers, each with its own nominal size range and sieve requirements. Selecting the correct size number for a project depends on the intended application, maximum aggregate size permitted, and any project specification requirements.
⭐⭐⭐⭐⭐ ASTM C33 Coarse Aggregate Size Numbers
Standardized size numbers correspond to specific gradations, not a single particle diameter.
| Size No. | Nominal Size Range |
|---|---|
| 57 | 1 in to No. 4 (25.0 to 4.75 mm) |
| 67 | 3/4 in to No. 4 (19.0 to 4.75 mm) |
| 7 | 1/2 in to No. 4 (12.5 to 4.75 mm) |
| 8 | 3/8 in to No. 8 (9.5 to 2.36 mm) |
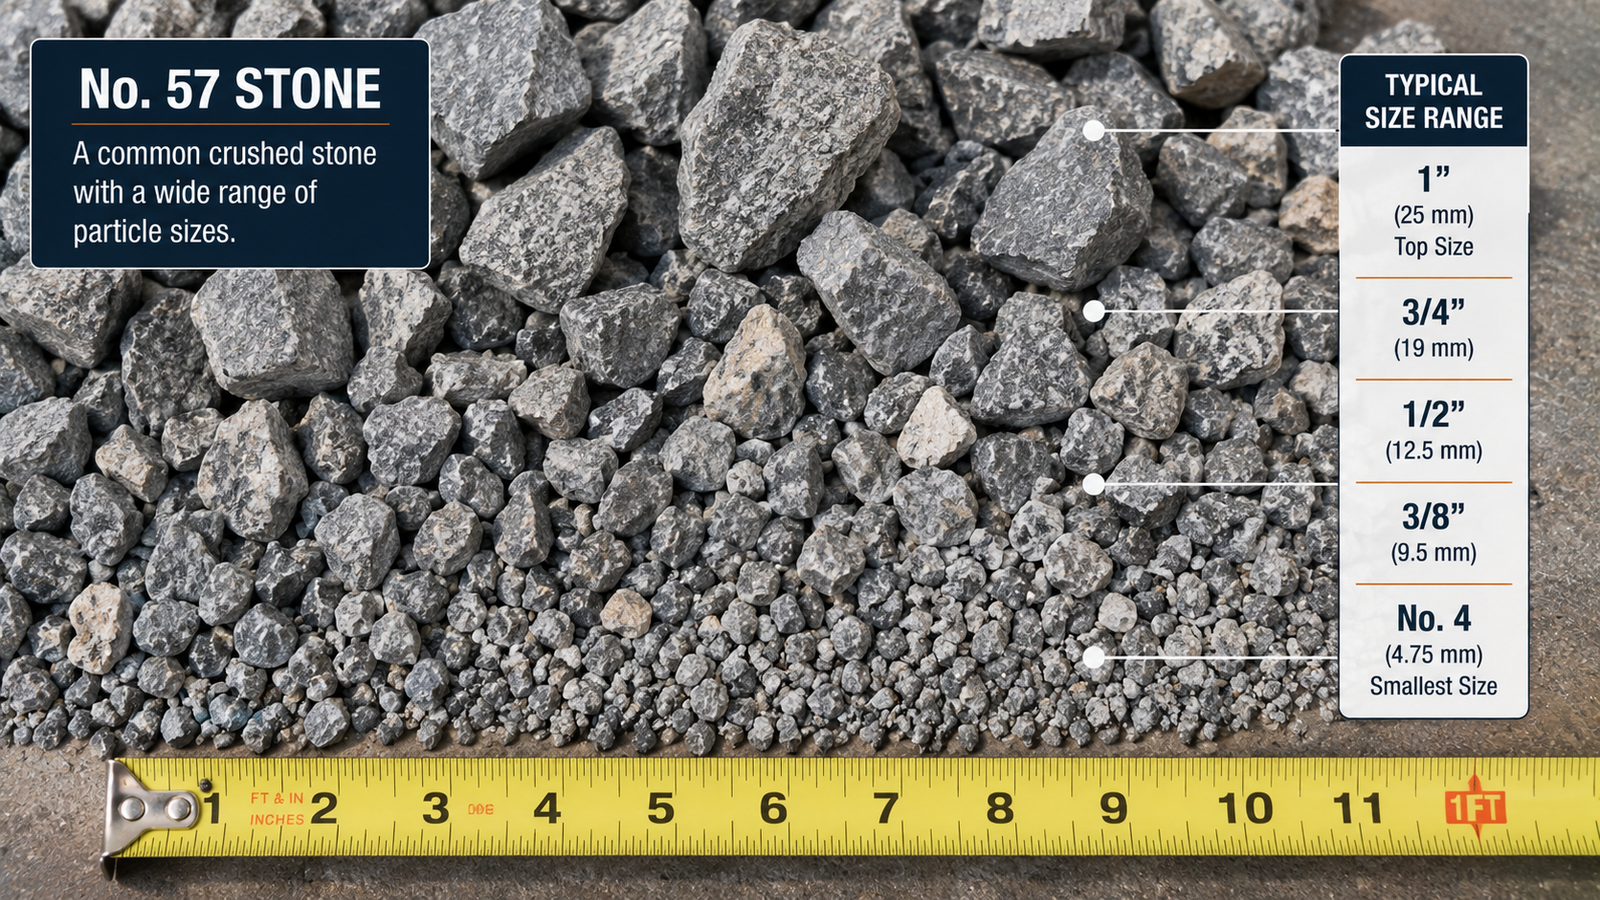
Referring to “No. 57 rock” as if it means every particle measures exactly 1 inch or 3/4 inch is a common misunderstanding. The number identifies a specific range of sieve requirements spanning from the nominal maximum size down to a fine sieve such as No. 4 or No. 8, with a distribution of particle sizes throughout that range.
⭐⭐⭐⭐⭐ No. 57 Aggregate Gradation
No. 57 stone is one of the most common coarse aggregate gradations in concrete and construction.
| Sieve | Percent Passing |
|---|---|
| 1 1/2 in | 100 |
| 1 in | 95 to 100 |
| 1/2 in | 25 to 60 |
| No. 4 | 0 to 10 |
| No. 8 | 0 to 5 |
What No. 57 means
No. 57 is an ASTM C33 coarse aggregate size designation covering particles nominally between 1 inch and the No. 4 sieve, with the specific percent passing distribution shown above.
Common applications
Commonly used in concrete mixtures, as a drainage aggregate, and as a base or fill material in various construction applications.
See the Crushed Stone Size Chart and the 57 Stone Calculator for additional reference and quantity estimation.
⭐⭐⭐⭐ No. 67 Aggregate Gradation
No. 67 is a smaller coarse aggregate gradation than No. 57, commonly used in similar applications.
| Sieve | Percent Passing |
|---|---|
| 1 in | 100 |
| 3/4 in | 90 to 100 |
| 3/8 in | 20 to 55 |
| No. 4 | 0 to 10 |
| No. 8 | 0 to 5 |
No. 67 has a smaller nominal maximum size than No. 57, since its distribution runs from 3/4 inch down to No. 4 rather than 1 inch down to No. 4. This makes No. 67 useful where a smaller top size is desired for concrete cover, pipe bedding, or drainage applications.
⭐⭐⭐⭐ Other Common Coarse Aggregate Gradations
Additional ASTM C33 size numbers commonly encountered in construction.
No. 7
Nominal range from 1/2 inch to No. 4, a smaller gradation than No. 67, used where a finer coarse aggregate is desired.
No. 8
Nominal range from 3/8 inch to No. 8, one of the smallest standard coarse aggregate gradations, often used in surface treatments and smaller applications.
Combined designations such as No. 467 and No. 56
Some size numbers combine digits to represent a blend spanning the range of their component numbers, and are often furnished as separate stockpiled sizes rather than one uniform product. Always verify the specific percent passing requirements for any combined designation from the current ASTM C33 table rather than assuming it averages the individual size numbers.
⭐⭐⭐⭐⭐ Fine vs Coarse Aggregate Gradation
A side by side comparison of how these two categories are defined and graded.
| Feature | Fine Aggregate | Coarse Aggregate |
|---|---|---|
| Typical boundary | Passes No. 4 sieve | Mostly retained on No. 4 sieve |
| Main role in concrete | Fills voids, contributes to workability | Provides volume and structural skeleton |
| Key gradation measure | Continuous sieve distribution, No. 4 to No. 100 | Size-number-based grading table |
| Governing standard (concrete) | ASTM C33 fine aggregate table | ASTM C33 coarse aggregate size number tables |
⭐⭐⭐⭐⭐ Combined Aggregate Gradation
Combined gradation reflects the total particle-size distribution of fine and coarse aggregate together in a concrete mixture.
Combined aggregate gradation is the resulting particle-size distribution when a specific proportion of fine aggregate is blended with a specific proportion of coarse aggregate. It affects particle packing, void content, and how much cement paste is needed to fill remaining voids and coat particle surfaces, which in turn relates to mixture workability and economy.
Various combined gradation targets and specification bands exist in industry practice and agency specifications, but these should not be presented as a single mandatory target applicable to every concrete mixture. Any specific combined gradation requirement should be tied to the applicable project specification.
⭐⭐⭐⭐⭐ Combined Aggregate Gradation Chart
An illustrative example of blending fine and coarse aggregate into a combined gradation.
| Sieve | Fine Aggregate % Passing | Coarse Aggregate % Passing | Combined % Passing (40% Fine / 60% Coarse) |
|---|---|---|---|
| 1 in | 100 | 97 | 98.2 |
| 1/2 in | 100 | 42 | 65.2 |
| No. 4 | 98 | 5 | 42.2 |
| No. 8 | 85 | 1 | 34.6 |
| No. 30 | 40 | 0 | 16.0 |
| No. 100 | 3 | 0 | 1.2 |
This example uses illustrative fine and coarse aggregate percent passing values consistent with materials that individually satisfy ASTM C33, blended at a 40 percent fine to 60 percent coarse ratio by mass, to demonstrate the calculation method. Actual combined gradation depends on the specific fine and coarse aggregate sources and blend proportions used on a given project.
⭐⭐⭐⭐⭐ How to Calculate Combined Aggregate Gradation
Combined gradation at each sieve is a weighted average of the fine and coarse aggregate passing percentages.
P(combined) = f(f) x P(f) + f(c) x P(c), where f(f) is the fraction of fine aggregate in the blend by mass, f(c) is the fraction of coarse aggregate in the blend by mass, P(f) is the fine aggregate percent passing a given sieve, and P(c) is the coarse aggregate percent passing that same sieve.
Worked calculation at the No. 4 sieve
⭐⭐⭐⭐⭐ Dense-Graded Aggregate
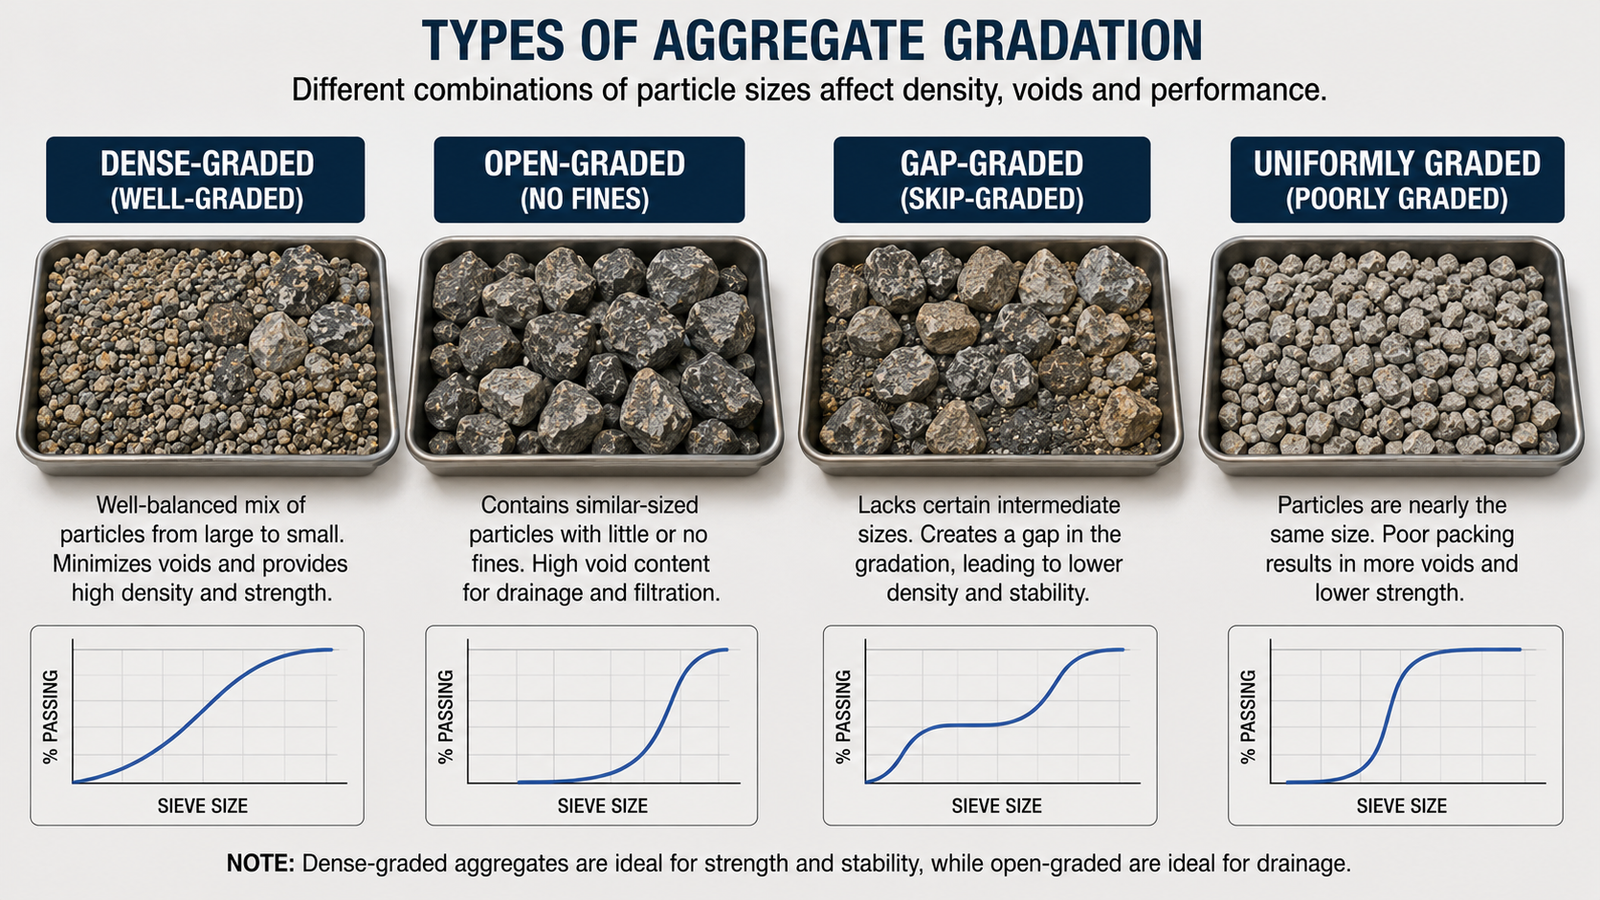
A broad, relatively continuous distribution of particle sizes designed to minimize void space.
Broad size distribution
Dense-graded aggregate contains a wide range of particle sizes, from the maximum size down through the fines.
Void-filling behavior
Smaller particles occupy the voids left between larger particles, producing a relatively dense, low-void material.
Continuous grading curve
The gradation curve for dense-graded material rises smoothly and continuously across the sieve range without significant gaps.
Applications
Common in concrete aggregate, base materials, and many pavement applications where density and load distribution are priorities.
⭐⭐⭐⭐⭐ Open-Graded Aggregate
Contains few fine particles, leaving larger interconnected voids for drainage.
Few fines
Open-graded material intentionally minimizes fine particle content, often keeping material passing the No. 200 sieve very low.
Larger connected voids
Without fines filling the spaces between larger particles, open-graded material retains substantial interconnected void space.
Drainage and permeability
The connected void structure gives open-graded aggregate significantly higher permeability than dense-graded material of similar maximum size.
⭐⭐⭐⭐⭐ Gap-Graded Aggregate
Intentionally limits or omits one or more intermediate particle-size fractions.
Intentional gap
One or more intermediate sieve fractions are deliberately reduced or absent from the distribution.
Distinct gradation curve
A gap-graded curve shows a flat or near-flat section at the intermediate sieves where material is missing, distinct from the smooth curve of dense-graded material.
Different packing behavior
Removing intermediate sizes changes how particles interlock and pack compared to a continuously graded material of the same maximum size.
⭐⭐⭐⭐ Uniformly Graded / Single-Sized Aggregate
A narrow range of particle sizes that are all relatively similar.
Narrow particle-size range
Most particles fall within a relatively tight size range rather than spanning from coarse to fine.
Higher void content
Without a range of smaller particles to fill gaps, uniformly graded material generally has higher void content than well-graded material of the same maximum size.
Specialized applications
Used in applications where high void content or specific drainage characteristics are desired, rather than dense packing.
Uniform gradation and well-graded material are distinct concepts. Well-graded material has a broad distribution across many sizes, while uniformly graded material has a narrow distribution concentrated around one size. Do not use these terms interchangeably.
⭐⭐⭐⭐⭐ Well-Graded vs Poorly Graded Aggregate
Two general classifications describing the breadth of a particle-size distribution.
| Classification | Description |
|---|---|
| Well graded | A broad, continuous distribution of particle sizes spanning from coarse to fine without significant gaps |
| Poorly graded | A limited or narrow size range, or a distribution missing one or more intermediate sizes |
These classification terms are used in geotechnical engineering, including soil classification systems that apply gradation parameters and specific criteria to distinguish poorly graded sands and gravels from well-graded ones. In concrete aggregate contexts, well graded material generally supports good particle packing and workability, though meeting a specification’s numeric grading limits is the definitive compliance test, not the general well-graded or poorly-graded label alone.
⭐⭐⭐⭐⭐ Maximum Aggregate Size
Generally the smallest sieve opening through which essentially all of the aggregate passes.
Maximum aggregate size is typically defined, depending on the applicable specification, as the smallest standard sieve opening through which 100 percent, or essentially all, of the aggregate sample passes. Because this definition depends on the specific standard or specification in use, always confirm which definition applies before comparing values across different sources.
⭐⭐⭐⭐⭐ Nominal Maximum Aggregate Size (NMAS)
A related but distinct term widely used in mixture proportioning.
What NMAS means
Nominal maximum aggregate size is generally the sieve size one size larger than the first sieve to retain more than a specified small percentage of the material, commonly used for mixture design purposes.
Why it matters
NMAS affects mixture proportioning, reinforcement clearance requirements, placement method, and pumpability of a given concrete mixture.
Concrete mixture proportioning
Mixture design procedures commonly reference NMAS when establishing water demand, cement content relationships, and other proportioning factors.
Placement and pumpability
A larger NMAS can affect how easily a mixture pumps through line diameters and finishes at exposed surfaces or tight reinforcement spacing.
Equipment for Your Project
Affiliate disclosure: As an Amazon Associate, ConcreteCalculate earns from qualifying purchases. We may also earn a commission from other affiliate links at no additional cost to you.
⭐⭐⭐⭐⭐ Maximum Size vs Nominal Maximum Size
These terms are frequently confused but are not identical.
| Term | General Definition |
|---|---|
| Maximum aggregate size | Smallest sieve through which essentially all (typically 100 percent) of the sample passes |
| Nominal maximum aggregate size (NMAS) | One sieve size larger than the first sieve retaining more than a specified small percentage of material; a small portion of the sample may still be retained on this sieve |
NMAS is typically one size class coarser than maximum size, because it tolerates a small percentage of oversized material rather than requiring 100 percent passing. Always identify which term a specification or mixture design document is actually using.
⭐⭐⭐⭐⭐ Percent Passing vs Percent Retained
The two basic quantities used to interpret any sieve analysis report.
Percent retained = (mass retained on sieve / total sample mass) x 100. Percent passing = 100 minus cumulative percent retained on that sieve and all coarser sieves above it.
⭐⭐⭐⭐⭐ Sieve Analysis Procedure
The standard workflow for determining aggregate gradation.
Use proper sampling and splitting procedures so the tested portion represents the full aggregate source.
Dry to a constant mass so moisture does not affect measured weights.
Record the starting mass before sieving begins.
Stack sieves from largest opening at the top to smallest opening at the bottom, with a pan underneath.
Use mechanical or manual shaking for a standardized duration to separate particles by size.
Record the mass retained on each individual sieve and in the bottom pan.
Convert retained masses to percent retained, cumulative percent retained, and percent passing for each sieve.
Graph percent passing against sieve size to visualize the distribution and compare against any applicable specification envelope.
AASHTO T27, Standard Method of Test for Sieve Analysis of Fine and Coarse Aggregates, is the commonly referenced test method for performing aggregate sieve analysis in highway and construction materials testing programs.
⭐⭐⭐⭐⭐ How to Read an Aggregate Gradation Report
A sample report layout and explanation of each column.
| Sieve | Weight Retained (g) | Percent Retained | Cumulative % Retained | Percent Passing |
|---|---|---|---|---|
| No. 4 | 20 | 2 | 2 | 98 |
| No. 8 | 130 | 13 | 15 | 85 |
| No. 16 | 200 | 20 | 35 | 65 |
| No. 30 | 250 | 25 | 60 | 40 |
| No. 50 | 250 | 25 | 85 | 15 |
| No. 100 | 120 | 12 | 97 | 3 |
| Pan | 30 | 3 | 100 | 0 |
Weight retained
The raw mass of material caught on each individual sieve during testing, based on a 1000 gram sample in this example.
Percent retained
Weight retained on that sieve divided by total sample weight, multiplied by 100.
Cumulative percent retained
Running total of percent retained, adding each sieve’s percent retained to the sum of all sieves above it.
Percent passing
100 minus the cumulative percent retained at that sieve, representing material finer than that sieve opening.
⭐⭐⭐⭐⭐ How to Plot an Aggregate Gradation Curve
The standard graphical format for visualizing gradation data.
Semi-log x-axis
Sieve size or particle size is commonly plotted on a logarithmic horizontal axis, since sieve openings span a wide range of magnitudes.
Percent passing y-axis
Cumulative percent passing is plotted on a standard linear vertical axis from 0 to 100 percent.
Specification envelope
Upper and lower specification limit curves can be plotted alongside the sample curve to visually check compliance.
Sample curve
The actual tested sample’s percent passing values are plotted and connected to form its unique gradation curve.
⭐⭐⭐⭐⭐ Aggregate Gradation Envelope
The region between a specification’s upper and lower limits at every sieve.
Upper limit
The maximum percent passing allowed at each sieve under the applicable specification.
Lower limit
The minimum percent passing allowed at each sieve under the applicable specification.
Target curve
Some specifications or mixture designs identify a preferred target curve within the broader envelope.
Out-of-spec result
A sample curve that crosses outside the upper or lower limit at any sieve does not meet that specification’s grading requirement at that sieve, using ASTM C33 fine aggregate as the reference example.
⭐⭐⭐⭐⭐ Fineness Modulus of Fine Aggregate
A single number summarizing average particle size, calculated directly from sieve analysis data.
FM equals the sum of the cumulative percent retained on the No. 4, No. 8, No. 16, No. 30, No. 50 and No. 100 sieves, divided by 100.
| Sieve | Percent Retained | Cumulative % Retained |
|---|---|---|
| No. 4 | 2 | 2 |
| No. 8 | 13 | 15 |
| No. 16 | 20 | 35 |
| No. 30 | 25 | 60 |
| No. 50 | 25 | 85 |
| No. 100 | 12 | 97 |
Fineness modulus calculation
Fineness modulus is a single summary number and does not by itself confirm that a sample satisfies every individual sieve’s percent passing limit. A sample can have an acceptable fineness modulus while still failing an individual sieve requirement, so FM should be used alongside, not instead of, the full sieve analysis.
⭐⭐⭐⭐⭐ How Aggregate Gradation Affects Concrete Workability
Gradation influences particle packing and paste demand, but is only one factor among several.
A well-distributed gradation generally supports good particle packing, which can reduce the volume of cement paste needed to fill voids and coat particle surfaces, supporting workability, finishability, and pumpability. Poorly optimized gradation, such as a harsh gap-graded blend lacking intermediate sizes, can produce a mixture that resists consolidation or finishes poorly. However, more fines does not automatically improve workability; excess fines can increase water and paste demand and create a sticky, harsh-handling mixture depending on the specific fines content and aggregate characteristics.
⭐⭐⭐⭐⭐ Aggregate Gradation and Water Demand
Gradation affects surface area and void content, both of which relate to water demand.
A poorly optimized particle-size distribution can increase the total surface area needing paste coverage or leave more void space to fill, which can increase water and paste demand in a given mixture. However, aggregate shape and surface texture also significantly affect water demand, so gradation alone should not be treated as the sole cause of a mixture’s water demand behavior.
⭐⭐⭐⭐⭐ Aggregate Gradation and Concrete Strength
Gradation is one contributing factor among several that affect concrete performance.
Good particle packing from favorable gradation can support proper consolidation and paste distribution, but compressive strength is primarily governed by the water-to-cementitious-materials ratio, along with proper consolidation, curing, and avoiding segregation. A well-graded aggregate does not guarantee high strength if the water-cementitious ratio or curing is deficient.
⭐⭐⭐⭐ Aggregate Gradation and Segregation
Certain gradation characteristics can increase the risk of segregation during placement.
Excess coarse particles
A mixture with disproportionately more coarse aggregate relative to paste and fines can be prone to segregation during placement and consolidation.
Insufficient fines
Too little fine material can leave a mixture harsh and less cohesive, increasing segregation risk.
Gap grading effects
A pronounced gap in intermediate particle sizes can affect how well the mixture holds together during placement.
Workability and placement method
Placement method, such as pumping or free-fall discharge, interacts with gradation to influence actual segregation risk on a given project.
⭐⭐⭐⭐ Aggregate Gradation and Bleeding
Gradation can influence bleeding, but is not the only, or necessarily primary, factor.
Aggregate gradation can affect mixture stability and the pathways available for water to migrate upward during bleeding, but bleeding is also strongly influenced by water content, cementitious materials content and fineness, chemical admixtures, air content, and ambient temperature. Treat gradation as one contributing variable among several rather than the primary determinant of bleeding behavior.
⭐⭐⭐⭐⭐ Aggregate Gradation for Pumped Concrete
Pumpability depends on a continuous particle-size distribution and adequate mortar fraction relative to pump line diameter.
Continuous particle-size distribution
A gap in the gradation curve can create pumping difficulties by disrupting the lubricating layer that helps concrete move through the line.
Mortar fraction
Adequate fine aggregate and paste content relative to coarse aggregate helps maintain a pumpable mixture.
Maximum aggregate size vs pump line diameter
Maximum aggregate size should be appropriately smaller than the pump line diameter to avoid blockages.
Specific gradation targets for pumped concrete depend on the mixture design, pump equipment, and line configuration used on a given project. Consult the mixture-specific requirements rather than applying one universal gradation target to every pumped mixture.
⭐⭐⭐⭐ Aggregate Gradation for Concrete Slabs and Pavements
Gradation affects finishability and surface characteristics of flatwork.
Finishability
A well-distributed gradation supports a workable surface mortar layer that finishers can work effectively.
Aggregate size relative to slab thickness
Maximum aggregate size is generally selected with consideration for slab thickness and finishing requirements.
Placement and consolidation
Gradation interacts with placement method and consolidation practice to affect the final surface quality of slabs and pavement.
⭐⭐⭐⭐ Aggregate Gradation for Base and Subbase
Gradation extends beyond concrete into unbound base and subbase applications.
Unbound base and subbase materials are also evaluated by gradation, typically reporting cumulative particle-size distribution across a wide sieve range from several inches down to the No. 200 sieve. Base course gradation requirements are generally set by the applicable transportation agency or project specification rather than ASTM C33, since C33 specifically addresses concrete aggregates.
⭐⭐⭐⭐ Aggregate Gradation for Drainage Applications
Open grading is often preferred where permeability is the primary goal.
Where water needs to move freely through an aggregate layer, such as in drainage backfill or permeable pavement base, an open-graded material with minimal fines is often preferred over a dense-graded material, since the larger interconnected voids allow water to pass through more readily. Specific drainage aggregate gradation requirements should come from the applicable project specification or drainage design.
⭐⭐⭐⭐⭐ ASTM C33 Aggregate Grading Requirements
The primary standards section anchoring this page’s concrete-related gradation data.
| Requirement | ASTM C33 Provision |
|---|---|
| Fine aggregate grading | Percent passing limits for 3/8 in through No. 100 sieves |
| Fine aggregate fineness modulus | Not less than 2.3 nor more than 3.1 |
| Fine aggregate sieve retention limit | Not more than 45 percent passing any one sieve and retained on the next consecutive sieve |
| Coarse aggregate size numbers | Separate percent passing tables for each standardized size number, such as No. 57 and No. 67 |
| Deleterious substances / fines limits | Separate limits on material passing the No. 200 sieve and other deleterious substances for both fine and coarse aggregate |
The fine aggregate table, No. 57 table, and No. 67 table on this page reproduce actual ASTM C33 specification limits. The combined gradation chart and worked examples are illustrative demonstrations of calculation method, not themselves a specification requirement.
⭐⭐⭐⭐ AASHTO Aggregate Gradation References
Transportation and highway agencies commonly reference parallel AASHTO standards.
AASHTO M43
Standard specification for sizes of aggregate for road and bridge construction, providing size designations similar in structure to ASTM C33 and ASTM D448 coarse aggregate size numbers.
AASHTO T27
Standard method of test for sieve analysis of fine and coarse aggregates, commonly referenced for highway and transportation materials testing.
⭐⭐⭐⭐⭐ Aggregate Gradation Worked Examples
Practical demonstrations of the calculations used throughout this chart.
1. Calculate percent passing from sieve weights
2. Check fine aggregate against the ASTM C33 envelope
3. Blend fine and coarse aggregate into a combined gradation
4. Identify a gap-graded curve
⭐⭐⭐⭐⭐ Common Aggregate Gradation Mistakes
Most gradation errors trace back to one of these misunderstandings.
❌ Confusing aggregate size with gradation
Nominal size describes one dimension; gradation describes the full particle-size distribution.
❌ Confusing percent retained and percent passing
These are complementary but different values calculated from the same sieve data.
❌ Misidentifying sieve sizes
Sieve numbers and their actual openings in inches or millimeters must be matched correctly using the standard sieve chart.
❌ Ignoring No. 200 fines
Material passing the No. 200 sieve has its own separate specification limits and cannot be inferred from the coarser sieve data alone.
❌ Using one coarse gradation for every ASTM size number
Each size number, such as No. 57 or No. 67, has its own distinct percent passing table.
❌ Confusing maximum size with NMAS
These terms use different definitions and are not interchangeable.
❌ Assuming well graded means compliant with every specification
A general well-graded description does not replace confirming actual compliance with a specific numeric specification.
❌ Ignoring sample representativeness
An unrepresentative sample can produce gradation results that do not reflect the actual aggregate source.
❌ Mixing ASTM and AASHTO designations without labels
Always identify which standard a specific size number or requirement comes from.
⭐⭐⭐⭐⭐ Aggregate Gradation Chart Limitations
Understanding what gradation data does not tell you is essential for material selection.
Gradation alone does not establish concrete quality
Many other mixture and material factors also govern final concrete performance.
Particle shape matters
Angular, rounded, or flat and elongated particles behave differently even at identical gradation.
Texture matters
Smooth versus rough particle surfaces affect paste bond and water demand independent of gradation.
Absorption and specific gravity matter
These properties affect mixture proportioning calculations separately from gradation.
Moisture affects testing and batching
Field moisture content must be accounted for separately from dry gradation test results.
Deleterious materials matter
Clay, shale, and other deleterious substances have their own separate specification limits beyond gradation.
Application and specification govern requirements
The applicable project specification, not a generic chart, determines actual compliance requirements.
Local DOT requirements may differ
State and local transportation agencies may specify their own gradation tables distinct from ASTM C33.
Frequently Asked Questions
📄 Download Aggregate Gradation Chart PDF
This PDF is a genuine field reference. Use the print button to create a print-ready or downloadable version.
Cite or Embed This Chart
Copy the page-wide citation to reference the complete Aggregate Gradation Chart.


![Rebar Size Chart - Complete #3 to No. 20 [64] Diameter, Area & Grade Reference](https://concretecalculate.com/wp-content/uploads/2026/07/Rebar-Size-Chart-2026-Complete-3-to-No.-20-64-Diameter-Area-Grade-Reference-390x220.png)