Concrete PSI Chart 2026: Complete Strength Reference – 1,500 to 10,000 PSI
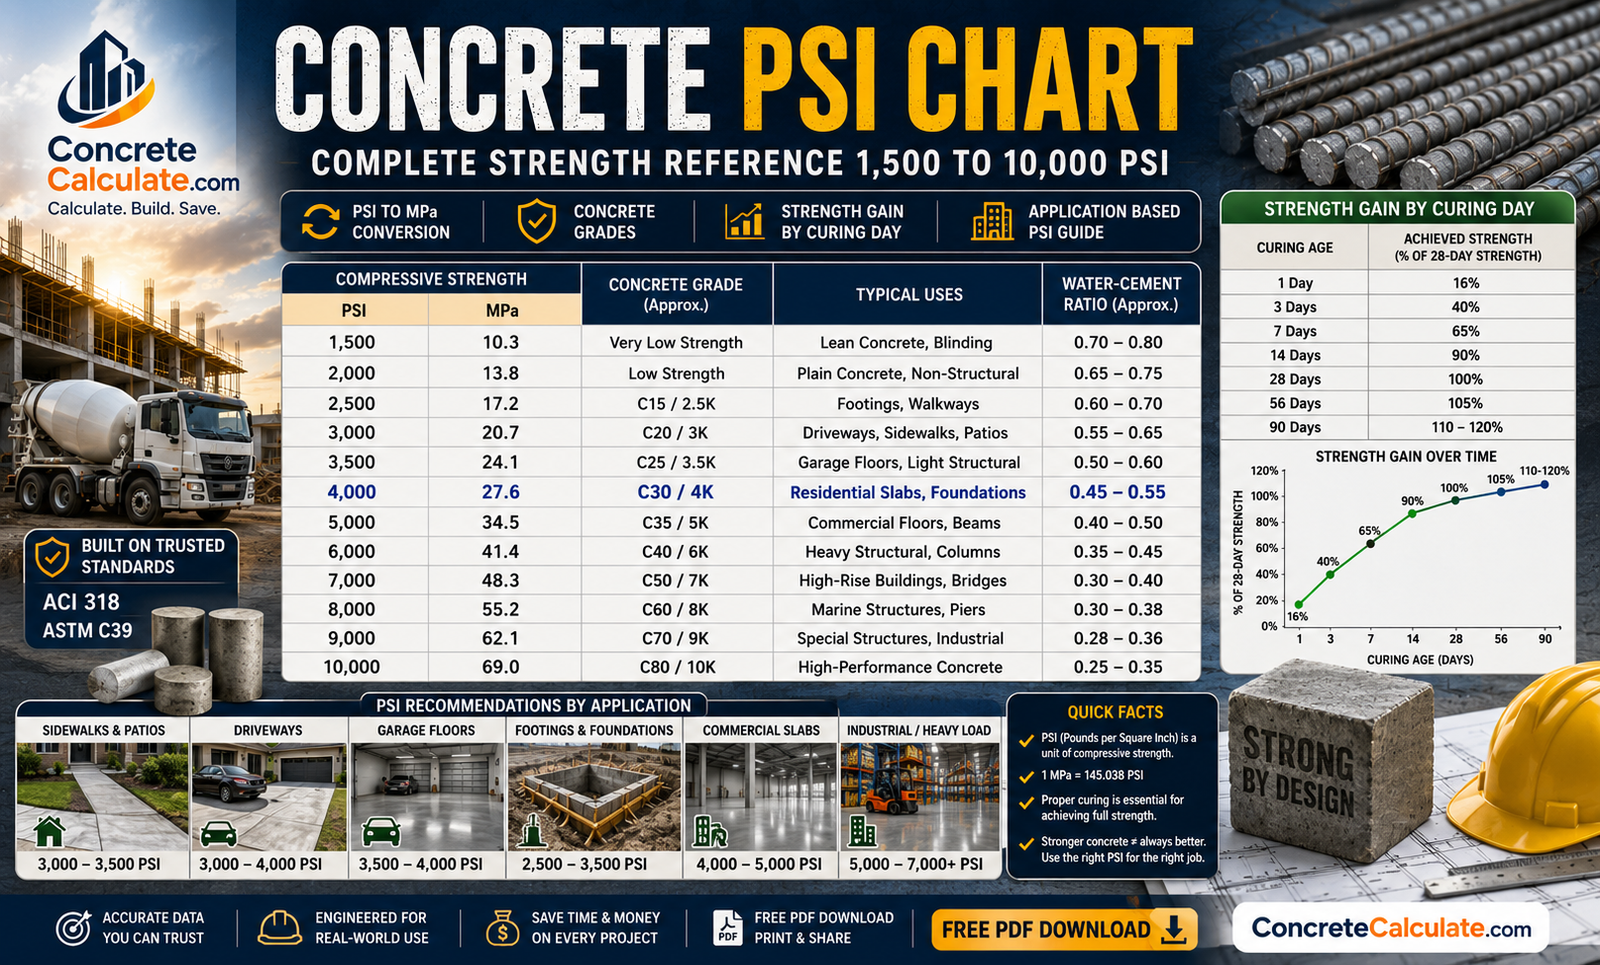
Concrete PSI Chart
Complete Strength Reference – 1,500 to 10,000 PSI
The most complete concrete PSI reference for contractors, engineers, and estimators — covering PSI/MPa conversions, concrete grades, strength gain over time, and application-based recommendations.
 Reviewed by Muhammad Ramzan Babar, PhD Researcher (Plasma Physics) & Calculator Developer — View Profile
⭐ Master Concrete PSI Chart
Complete reference from 1,500 PSI to 10,000 PSI including MPa, equivalent grade, and common uses.
How to Read This Chart
PSI (pounds per square inch) measures compressive strength at 28 days of curing. Higher PSI means stronger, more durable concrete but typically higher material cost. Use our Concrete Mix Ratio Calculator to plan your exact mix.
| PSI | MPa | Nearest Grade | Common Uses |
|---|---|---|---|
| 1,500 | 10.3 | ~M10 | Non-structural fill, blinding |
| 2,000 | 13.8 | ~M15 | Pathways, floor bases |
| 2,500 | 17.2 | ~M17 | Residential footings, foundations |
| 3,000 | 20.7 | M20 | Sidewalks, patios, standard driveways |
| 3,500 | 24.1 | ~M23 | Driveways in cold climates, garage floors |
| 4,000 | 27.6 | M27 | Garage floors, structural slabs, bridge decks |
| 4,500 | 31.0 | ~M31 | Heavy-duty slabs, commercial floors |
| 5,000 | 34.5 | M35 | Columns, structural beams, warehouse floors |
| 6,000 | 41.4 | M40 | High-rise columns, industrial floors |
| 7,000 | 48.3 | ~M48 | High-strength structural elements |
| 8,000 | 55.2 | M55 | High-rise cores, precast structural members |
| 10,000 | 68.9 | ~M69 | Ultra-high strength, specialty structural applications |
★ Highlighted rows are the most common range used in residential construction. Source: ACI 318, ASTM C39 compressive strength testing standards.
Residential Concrete PSI Chart
Recommended PSI ranges for common residential concrete applications.
| Application | Recommended PSI | MPa | Notes |
|---|---|---|---|
| Sidewalks | 3,000–3,500 | 20.7–24.1 | Pedestrian traffic only |
| Patios | 3,000–3,500 | 20.7–24.1 | Decorative finishes reduce required PSI slightly |
| Walkways | 3,000 | 20.7 | Standard for light foot traffic |
| Driveways | 3,500–4,000 | 24.1–27.6 | Higher PSI for cold/freeze-thaw climates |
| Garage Floors | 4,000 | 27.6 | Withstands vehicle and equipment loads |
| House Foundations | 3,000–4,000 | 20.7–27.6 | Depends on soil bearing capacity & local code |
Commercial Concrete PSI Chart
Recommended PSI ranges for commercial and industrial applications.
| Application | Recommended PSI | MPa | Notes |
|---|---|---|---|
| Parking Lots | 4,000 | 27.6 | Vehicle traffic, weather exposure |
| Warehouses | 4,000–5,000 | 27.6–34.5 | Forklift & racking point loads |
| Office Buildings | 4,000–5,000 | 27.6–34.5 | Structural slabs and columns |
| Industrial Floors | 4,500–5,500 | 31.0–37.9 | Heavy equipment, abrasion resistance |
| Loading Docks | 4,500–5,000 | 31.0–34.5 | Impact loading from trucks/forklifts |
Concrete PSI to MPa Conversion Chart
Formula: MPa = PSI × 0.00689476
| PSI | MPa |
|---|---|
| 2,000 | 13.8 |
| 2,500 | 17.2 |
| 3,000 | 20.7 |
| 3,500 | 24.1 |
| 4,000 | 27.6 |
| 4,500 | 31.0 |
| 5,000 | 34.5 |
| 6,000 | 41.4 |
| 8,000 | 55.2 |
| 10,000 | 68.9 |
MPa to PSI Conversion Chart
Formula: PSI = MPa × 145.038
| MPa | PSI |
|---|---|
| 10 | 1,450 |
| 15 | 2,176 |
| 20 | 2,901 |
| 25 | 3,626 |
| 30 | 4,351 |
| 35 | 5,076 |
| 40 | 5,802 |
| 50 | 7,252 |
| 60 | 8,702 |
Concrete Grade Comparison Chart
Standard Indian/international M-grades with equivalent MPa and PSI values.
| Grade | MPa | PSI | Mix Type |
|---|---|---|---|
| M5 | 5 | 725 | Nominal |
| M7.5 | 7.5 | 1,088 | Nominal |
| M10 | 10 | 1,450 | Nominal |
| M15 | 15 | 2,175 | Nominal |
| M20 | 20 | 2,900 | Nominal |
| M25 | 25 | 3,625 | Standard/Design |
| M30 | 30 | 4,350 | Design |
| M35 | 35 | 5,075 | Design |
| M40 | 40 | 5,800 | Design |
| M45 | 45 | 6,525 | Design (High Strength) |
| M50 | 50 | 7,250 | Design (High Strength) |
Concrete Strength Gain Chart
Approximate percentage of 28-day design strength achieved at each curing milestone, per ASTM C39.
| Curing Age | % of 28-Day Strength | Example: 4,000 PSI Mix |
|---|---|---|
| 1 Day | 16% | ~640 PSI |
| 3 Days | 40% | ~1,600 PSI |
| 7 Days | 65% | ~2,600 PSI |
| 14 Days | 90% | ~3,600 PSI |
| 28 Days | 99–100% | ~4,000 PSI |
| 56 Days | 105–110% | ~4,200–4,400 PSI |
| 90 Days | 110–120% | ~4,400–4,800 PSI |
Percentages are approximate for Type I/II Portland cement under standard moist curing at 70°F. Actual gain varies with mix design, admixtures, and curing temperature.
Recommended PSI by Construction Application
Quick-reference table for choosing the right PSI for common structural elements.
| Application | Recommended PSI |
|---|---|
| Footings | 2,500–3,500 |
| Slabs | 3,000–4,000 |
| Columns | 4,000–6,000 |
| Beams | 4,000–5,000 |
| Sidewalks | 3,000–3,500 |
| Driveways | 3,500–4,000 |
| Garage Floors | 4,000 |
| Retaining Walls | 3,500–4,500 |
| Basement Floors | 3,000–3,500 |
Water-Cement Ratio vs Strength Chart
How the water-cement (w/c) ratio directly influences compressive strength — lower w/c means higher strength.
| Water-Cement Ratio | Approx. 28-Day Strength (PSI) | Approx. MPa |
|---|---|---|
| 0.35 | 6,000+ | 41.4+ |
| 0.40 | 5,500 | 37.9 |
| 0.45 | 5,000 | 34.5 |
| 0.50 | 4,000 | 27.6 |
| 0.55 | 3,500 | 24.1 |
| 0.60 | 3,000 | 20.7 |
| 0.65 | 2,500 | 17.2 |
| 0.70 | 2,000 | 13.8 |
Key Takeaway
Every 0.05 reduction in water-cement ratio can increase strength by roughly 500 PSI. Check your mix with our Water-Cement Ratio Calculator.
Air Content vs Concrete Strength Chart
Air-entrainment is essential for freeze-thaw durability but reduces compressive strength — useful for durable concrete design.
| Air Content (%) | Approx. Strength Reduction | Recommended Use |
|---|---|---|
| 0–2% | Baseline (0%) | Interior, non-exposed concrete |
| 3–4% | ~6–12% | Mild freeze-thaw exposure |
| 5–6% | ~10–18% | Moderate freeze-thaw, deicing salt exposure |
| 6–7% | ~12–22% | Severe freeze-thaw climates (driveways, sidewalks) |
| 8%+ | ~20–30% | Rarely used; excessive strength loss |
Concrete Cylinder Test Reference Chart
Standard testing specifications per ASTM C39.
| Cylinder Size | Testing Age | ASTM Standard | Expected Strength |
|---|---|---|---|
| 6 in × 12 in | 7 Days | ASTM C39 | ~65% of 28-day design strength |
| 6 in × 12 in | 28 Days | ASTM C39 | 100% of design strength (f’c) |
| 4 in × 8 in | 28 Days | ASTM C39 | 100% of design strength (smaller aggregate mixes) |
| 6 in × 12 in | 56 Days | ASTM C39 | ~105–110% of design strength |
| 6 in × 12 in | 90 Days | ASTM C39 | ~110–120% of design strength |
Concrete Strength Classes Around the World
Comparing US, European, and Indian concrete strength classifications side by side.
| USA (PSI) | Europe (C-Class) | India (M Grade) | MPa |
|---|---|---|---|
| 1,450 | C8/10 | M10 | 10 |
| 2,175 | C12/15 | M15 | 15 |
| 2,900 | C16/20 | M20 | 20 |
| 3,625 | C20/25 | M25 | 25 |
| 4,350 | C25/30 | M30 | 30 |
| 5,075 | C28/35 | M35 | 35 |
| 5,800 | C32/40 | M40 | 40 |
| 7,250 | C40/50 | M50 | 50 |
Why This Matters
International contractors and engineers frequently need to cross-reference specs written in different regional standards — this table bridges US, EU, and Indian systems in one place.
PSI Selection Guide
Not sure which PSI to choose? Use this decision table for common projects.
| Project | Recommended PSI | Why |
|---|---|---|
| Backyard patio | 3,000 | Light foot traffic, no vehicles |
| Standard driveway | 3,500 | Balances cost with vehicle load capacity |
| Driveway (cold climate) | 4,000 + air-entrainment | Resists freeze-thaw cracking and deicing salt damage |
| Garage floor | 4,000 | Withstands vehicle weight and tool drops |
| Shed foundation | 2,500–3,000 | Light structural load, no dynamic forces |
| Warehouse floor | 4,500–5,000 | Forklift traffic and heavy point loads |
| Bridge deck | 4,000–4,500+ | DOT specs require durability under traffic and weather |
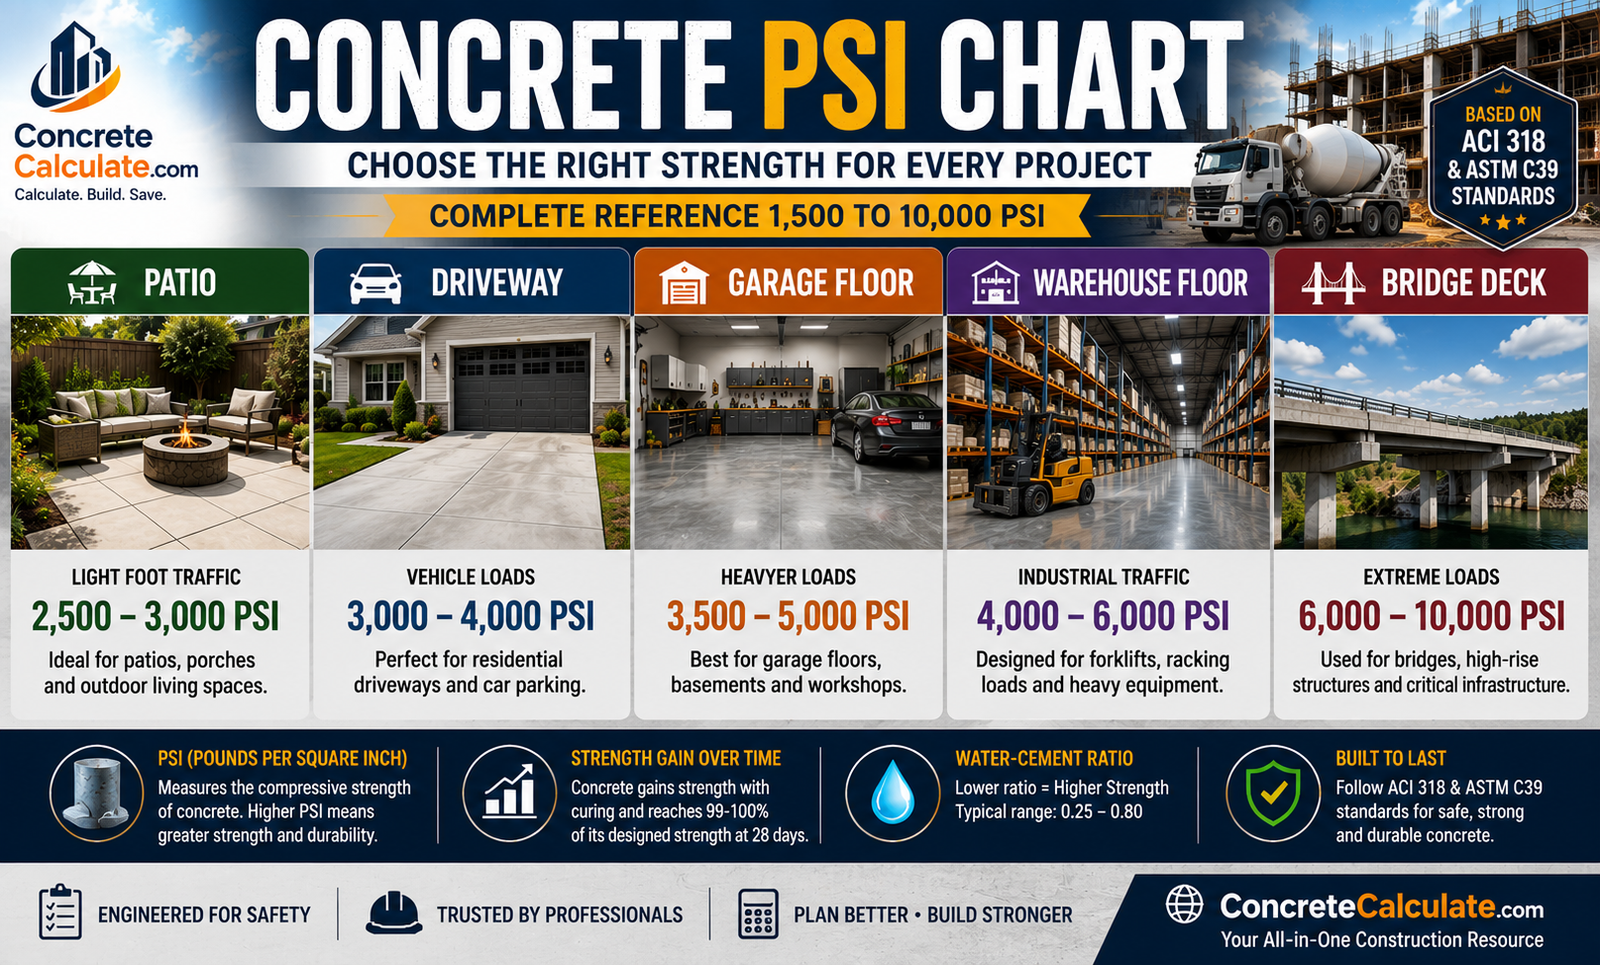
Visual Strength Comparison
How different PSI levels relate to common construction projects, at a glance.
Contractor Worked Examples
Real-world PSI selection and strength verification scenarios.
Residential Driveway — Selecting PSI
Foundation Footing — Strength Verification
Warehouse Floor — Load-Based Selection
Bridge Deck — Converting DOT Spec to PSI
Frequently Asked Questions
📥 Download Concrete PSI Chart PDF
Use your browser’s print function to instantly save this page as a PDF. This avoids broken file links and gives you an always up-to-date printable version for jobsite binders, estimating folders, and contractor reference kits.