Water Cement Ratio Chart 2026: Strength, Grade & Application Guide
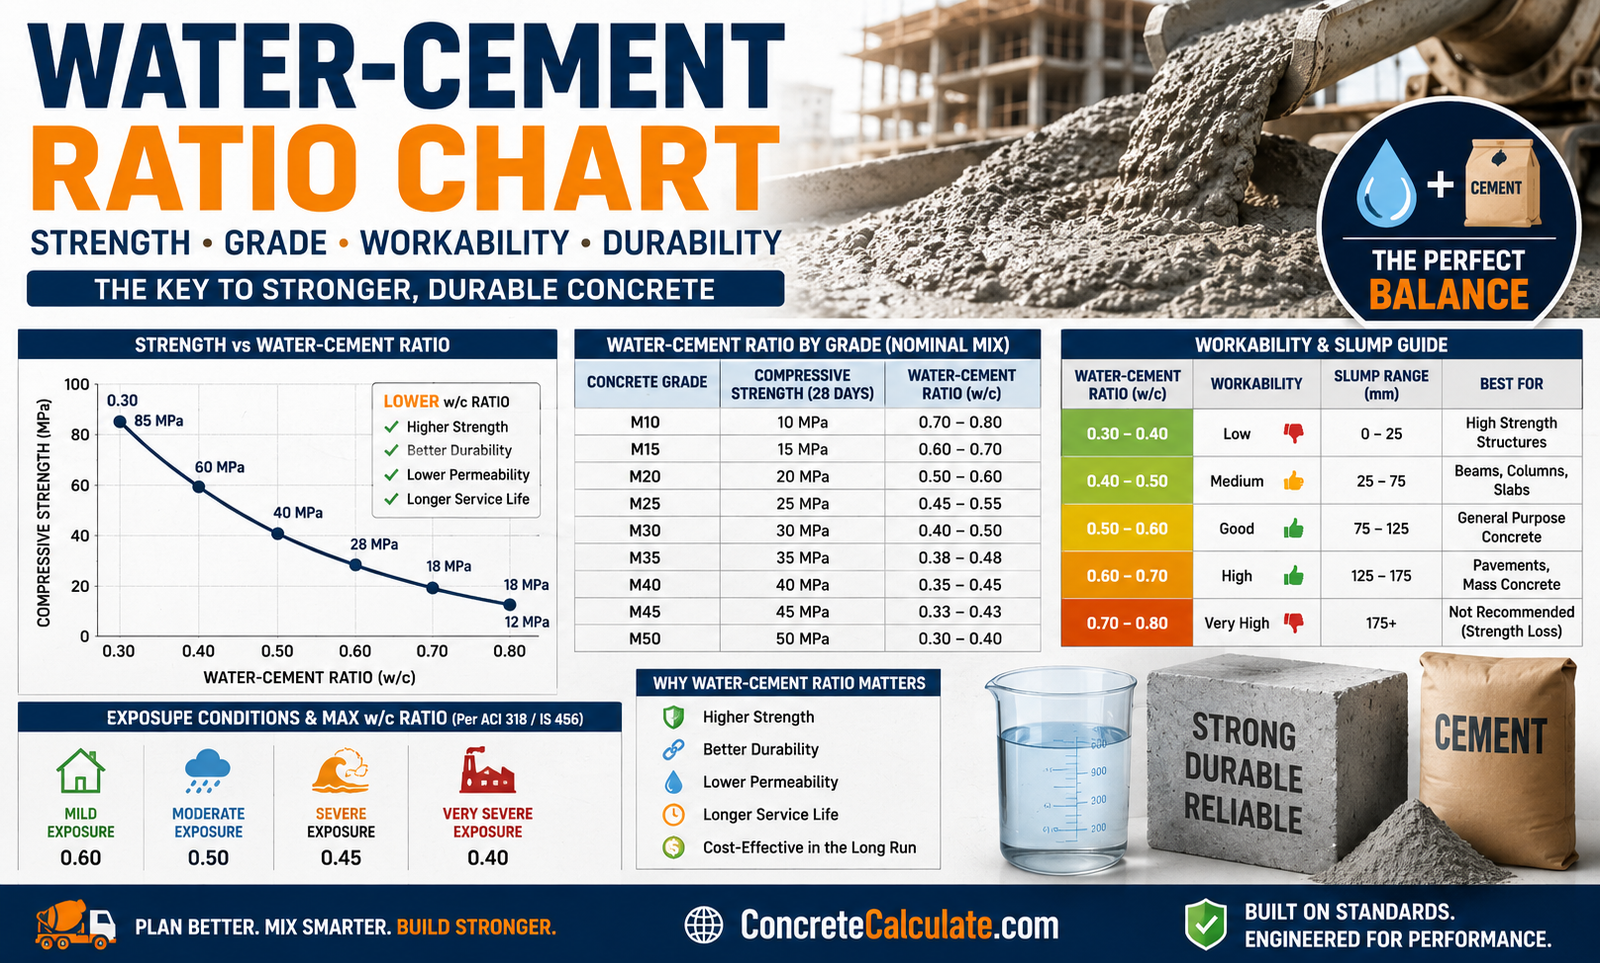
Water Cement Ratio Chart
Strength, Grade & Application Guide
The complete w/c ratio reference for contractors, engineers, and students — strength correlation, grade-wise tables, workability, and exposure-based recommendations.
 Reviewed by Muhammad Ramzan Babar, PhD Researcher (Plasma Physics) & Calculator Developer — View Profile
⭐ Master Water Cement Ratio Chart
Complete reference showing water-cement ratio, expected strength, workability, and common applications at a glance.
How to Read This Chart
Water-cement (w/c) ratio is the weight of water divided by the weight of cement in a mix. Lower ratios yield stronger, more durable concrete but reduced workability. Calculate your exact mix with our Water-Cement Ratio Calculator.
| W/C Ratio | Approx. Strength (PSI) | Workability | Common Application |
|---|---|---|---|
| 0.35 | 6,500+ | Very Low | High-strength precast, industrial floors |
| 0.40 | 6,000 | Low | Structural columns, bridge decks |
| 0.45 | 5,000 | Low–Medium | Footings, foundations, beams |
| 0.50 | 4,500 | Medium | Driveways, slabs, garage floors |
| 0.55 | 4,000 | Medium–High | Sidewalks, patios, residential slabs |
| 0.60 | 3,500 | High | Non-structural fill, mass concrete |
| 0.68+ | 3,000 or less | Very High | Not recommended for structural use |
Water-Cement Ratio vs Concrete Strength Chart
This is the core relationship most engineers reference — approximate 28-day compressive strength by w/c ratio, per ACI 211.1.
| Water-Cement Ratio | Non-Air-Entrained (PSI/MPa) | Air-Entrained (PSI/MPa) |
|---|---|---|
| 0.41 | 6,000 (41.4) | — |
| 0.48 | 5,000 (34.5) | 4,000 (27.6) approx. |
| 0.57 | 4,000 (27.6) | 3,500 (24.1) approx. |
| 0.68 | 3,000 (20.7) | 2,700 (18.6) approx. |
| 0.82 | 2,000 (13.8) | 1,800 (12.4) approx. |
Source: ACI 211.1-91, Table 6.3.4(a). Air-entrained values are approximate reductions for freeze-thaw resistant mixes. See our Concrete PSI Chart for full strength grade breakdowns.
Water-Cement Ratio by Concrete Grade
Standard IS-grade concrete with typical w/c ratio, strength, and common uses.
| Grade | Typical W/C Ratio | Approx. Strength | Common Uses |
|---|---|---|---|
| M10 | 0.55–0.60 | 10 MPa (1,450 PSI) | Leveling course, non-structural work |
| M15 | 0.50–0.55 | 15 MPa (2,175 PSI) | Foundations, flooring, mass concrete |
| M20 | 0.50–0.55 | 20 MPa (2,900 PSI) | Slabs, beams, residential columns |
| M25 | 0.45–0.50 | 25 MPa (3,625 PSI) | RCC structures, commercial buildings |
| M30 | 0.40–0.45 | 30 MPa (4,350 PSI) | Prestressed concrete, heavy loads |
| M35 | 0.35–0.40 | 35 MPa (5,075 PSI) | High-rise buildings, bridges |
| M40 | 0.35–0.40 | 40 MPa (5,800 PSI) | Heavy-duty industrial structures |
| M50 | 0.30–0.35 | 50 MPa (7,250 PSI) | High-performance structures |
Grade-wise ratios per IS 456/10262 nominal mix guidance. Design mixes (M30+) require lab trial mixes for exact proportioning.
⭐ Water-Cement Ratio by Construction Application
Recommended w/c ratio by project type — balancing strength, durability, and finishing needs.
| Project | Recommended W/C Ratio |
|---|---|
| Footings | 0.45–0.50 |
| Foundations | 0.45–0.50 |
| Driveways | 0.45–0.50 |
| Sidewalks | 0.50–0.55 |
| Patios | 0.50–0.55 |
| Garage Floors | 0.45–0.50 |
| Slabs | 0.45–0.55 |
| Columns | 0.40–0.45 |
| Beams | 0.40–0.45 |
| Bridge Decks | 0.40 or lower |
Plan your mix quantities using our Concrete Mix Design Calculator.
Water-Cement Ratio vs Workability Chart
Workability increases with water content, but at the cost of strength and durability.
| Workability Level | W/C Ratio Range | Slump Characteristic |
|---|---|---|
| Very Low | 0.30–0.35 | 0–25 mm, requires vibration/superplasticizer |
| Low | 0.40–0.45 | 25–50 mm, stiff mix |
| Medium | 0.45–0.55 | 50–100 mm, standard placement |
| High | 0.55–0.65 | 100–150 mm, easy flow, higher shrinkage risk |
| Very High | 0.65+ | 150 mm+, flows easily, segregation risk |
Water-Cement Ratio vs Slump Chart
Slump is a direct field indicator of relative water content and workability. Learn testing procedure in our Concrete Slump Test Guide.
| W/C Ratio | Typical Slump | Recommended Applications |
|---|---|---|
| 0.40 | 25–50 mm (1–2 in) | High-strength columns, precast |
| 0.45 | 50–75 mm (2–3 in) | Footings, beams, foundations |
| 0.50 | 75–100 mm (3–4 in) | Slabs, driveways, general use |
| 0.55 | 100–125 mm (4–5 in) | Sidewalks, patios, pumped concrete |
| 0.60+ | 125–150+ mm (5–6+ in) | Not recommended without admixtures |
Water-Cement Ratio vs Durability Chart
Increasing water content beyond design levels affects multiple durability factors simultaneously.
| Factor | Effect of Increasing W/C Ratio |
|---|---|
| Strength | Decreases significantly — more capillary porosity in hardened paste |
| Permeability | Increases — water and chlorides penetrate more easily |
| Freeze-Thaw Resistance | Decreases — higher porosity allows more water to freeze and expand |
| Sulfate Resistance | Decreases — denser paste at low w/c resists chemical attack better |
| Shrinkage | Increases — more evaporable water increases drying shrinkage |
Water-Cement Ratio by Exposure Conditions
Environmental exposure dictates the maximum permissible w/c ratio, per ACI 318 and IS 456 durability requirements.
| Exposure Condition | Maximum W/C Ratio |
|---|---|
| Interior Concrete | 0.55–0.60 (strength-governed) |
| Exterior Concrete | 0.50 |
| Marine Structures | 0.40 |
| Freeze-Thaw Regions | 0.45 |
| Hot Weather | 0.45–0.50 (with retarders/evaporation control) |
| Cold Weather | 0.45–0.50 (with accelerators, protection) |
| Industrial Environments | 0.40–0.45 (chemical/abrasion exposure) |
Source: IS 456-2000 Table 5 and ACI 318 durability requirements. Coastal/marine work should also reference minimum cement content and cover rules.
Water-Cement Ratio for Different Cement Types
Cement chemistry affects hydration rate and water demand, shifting the optimal w/c ratio slightly.
| Cement Type | Typical W/C Ratio | Notes |
|---|---|---|
| Ordinary Portland Cement (OPC) | 0.40–0.55 | Standard baseline for most structural work |
| Portland Pozzolana Cement (PPC) | 0.45–0.55 | Slightly higher water demand, slower early strength |
| Sulfate Resistant Cement | 0.40–0.45 | Lower ratio needed to maximize chemical resistance |
| High-Early Strength Cement | 0.40–0.50 | Finer grind increases water demand slightly, faster strength gain |
Water-Cement Ratio vs Concrete Mix Ratio
Popular nominal mix proportions and their typical recommended w/c ratio. Explore full proportions in our Concrete Mix Ratio Chart.
| Mix Ratio (Cement:Sand:Aggregate) | Grade Equivalent | Recommended W/C Ratio |
|---|---|---|
| 1:3:6 | M10 | 0.55–0.60 |
| 1:2:4 | M15 | 0.50–0.55 |
| 1:1.5:3 | M20 | 0.50–0.55 |
| 1:1:2 | M25 | 0.45–0.50 |
Try the exact quantities with our 1:2:4 Mix Calculator or 1:3:6 Mix Calculator.
Water-Cement Ratio Conversion Table
Quick field reference for cement weight, water volume, and resulting ratio — useful when batching by hand.
| Cement (kg) | Water (L) | Water-Cement Ratio |
|---|---|---|
| 50 | 17.5 | 0.35 |
| 50 | 20 | 0.40 |
| 50 | 22.5 | 0.45 |
| 50 | 25 | 0.50 |
| 50 | 27.5 | 0.55 |
| 50 | 30 | 0.60 |
Based on a standard 50 kg (1 bag) cement unit. Use our Cement Calculator to scale for your project volume.
Water-Cement Ratio Selection Guide
Decision table linking project type to recommended ratio and the reasoning behind it.
| Project | Recommended Ratio | Why |
|---|---|---|
| Residential driveway | 0.45–0.50 | Balances strength for vehicle loads with workability and freeze-thaw durability |
| House foundation | 0.45–0.50 | Needs strength and moderate permeability for below-grade moisture exposure |
| Garage floor | 0.45–0.50 | Vehicle loading and abrasion resistance require lower porosity |
| Structural beam | 0.40–0.45 | Higher design stresses require higher strength and lower shrinkage |
| Marine/coastal structure | 0.40 or lower | Chloride exposure demands very low permeability for corrosion protection |
| Sidewalk/patio | 0.50–0.55 | Lower structural demand allows more workability for finishing |
⭐ Low vs High Water-Cement Ratio Comparison
A side-by-side look at the trade-offs between low and high water content mixes.
✅ Low W/C Ratio (0.35–0.45)
- Strength: High compressive strength
- Durability: Excellent — dense, low-permeability paste
- Workability: Low — stiff mix, harder to place
- Shrinkage: Lower drying shrinkage
- Cracking Risk: Lower, if properly placed and cured
- Permeability: Low — better resistance to water/chloride ingress
⚠️ High W/C Ratio (0.55–0.70+)
- Strength: Significantly reduced compressive strength
- Durability: Poor — more porous, vulnerable to freeze-thaw/sulfate
- Workability: High — flows and finishes easily
- Shrinkage: Higher drying shrinkage
- Cracking Risk: Higher, especially plastic shrinkage cracking
- Permeability: High — increased risk of corrosion and deterioration
Common Water-Cement Ratio Mistakes
Field errors that compromise the designed w/c ratio and resulting concrete quality.
Adding extra water on site
Adding water at the truck or job site to improve pourability dilutes the design ratio, silently reducing final strength.
Incorrect batching
Inaccurate measuring of cement or water at the mixing stage throws off the intended ratio before placement even begins.
Poor curing
Even a correctly batched mix loses potential strength if moisture is allowed to evaporate before hydration completes.
Reduced strength
A common downstream effect of excess water — strength can drop 20-30% for even a moderate increase in w/c ratio.
Segregation
Overly wet mixes allow heavier aggregate to settle and separate from the paste during transport or placement.
Bleeding
Excess water rises to the surface after placement, weakening the top layer and causing dusting or scaling later.
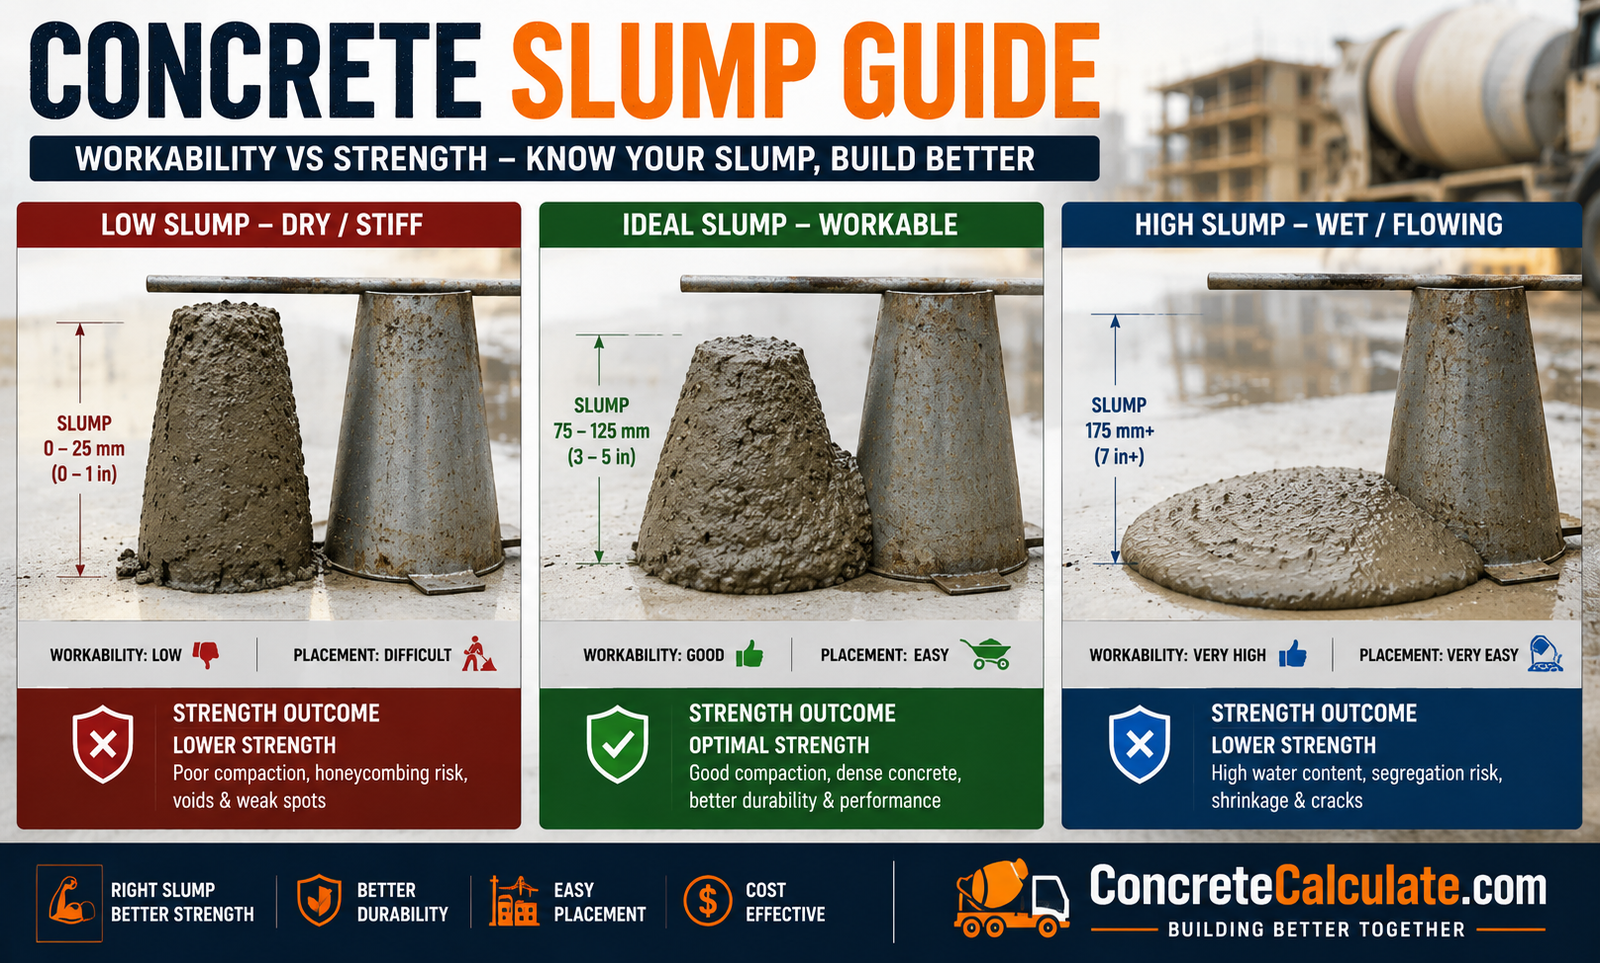
Visual Water-Cement Ratio Guide
Comparing dry, ideal, and wet mixes side by side.
Dry Mix (Low W/C)
Stiff, crumbly appearance. High strength potential but difficult to place without vibration or plasticizers.
Ideal Mix (0.45–0.50)
Cohesive, plastic consistency. Flows into forms, finishes smoothly, and reaches design strength with proper curing.
Wet Mix (High W/C)
Runny, glossy appearance. Easy to place but prone to segregation, bleeding, shrinkage cracking, and low final strength.
Contractor Worked Examples
Real-world w/c ratio decisions for common job scenarios.
Residential Driveway
Foundation Footing
Garage Floor
Structural Beam
Industrial Slab
Frequently Asked Questions
📥 Download Water-Cement Ratio Chart PDF
Use your browser’s print function to instantly save this page as a PDF. This avoids broken file links and gives you an always up-to-date printable reference for contractors, engineers, students, and inspectors.