Concrete Mix Ratio Chart M5 to M40 – Cement Sand Aggregate Ratio, PSI & MPa
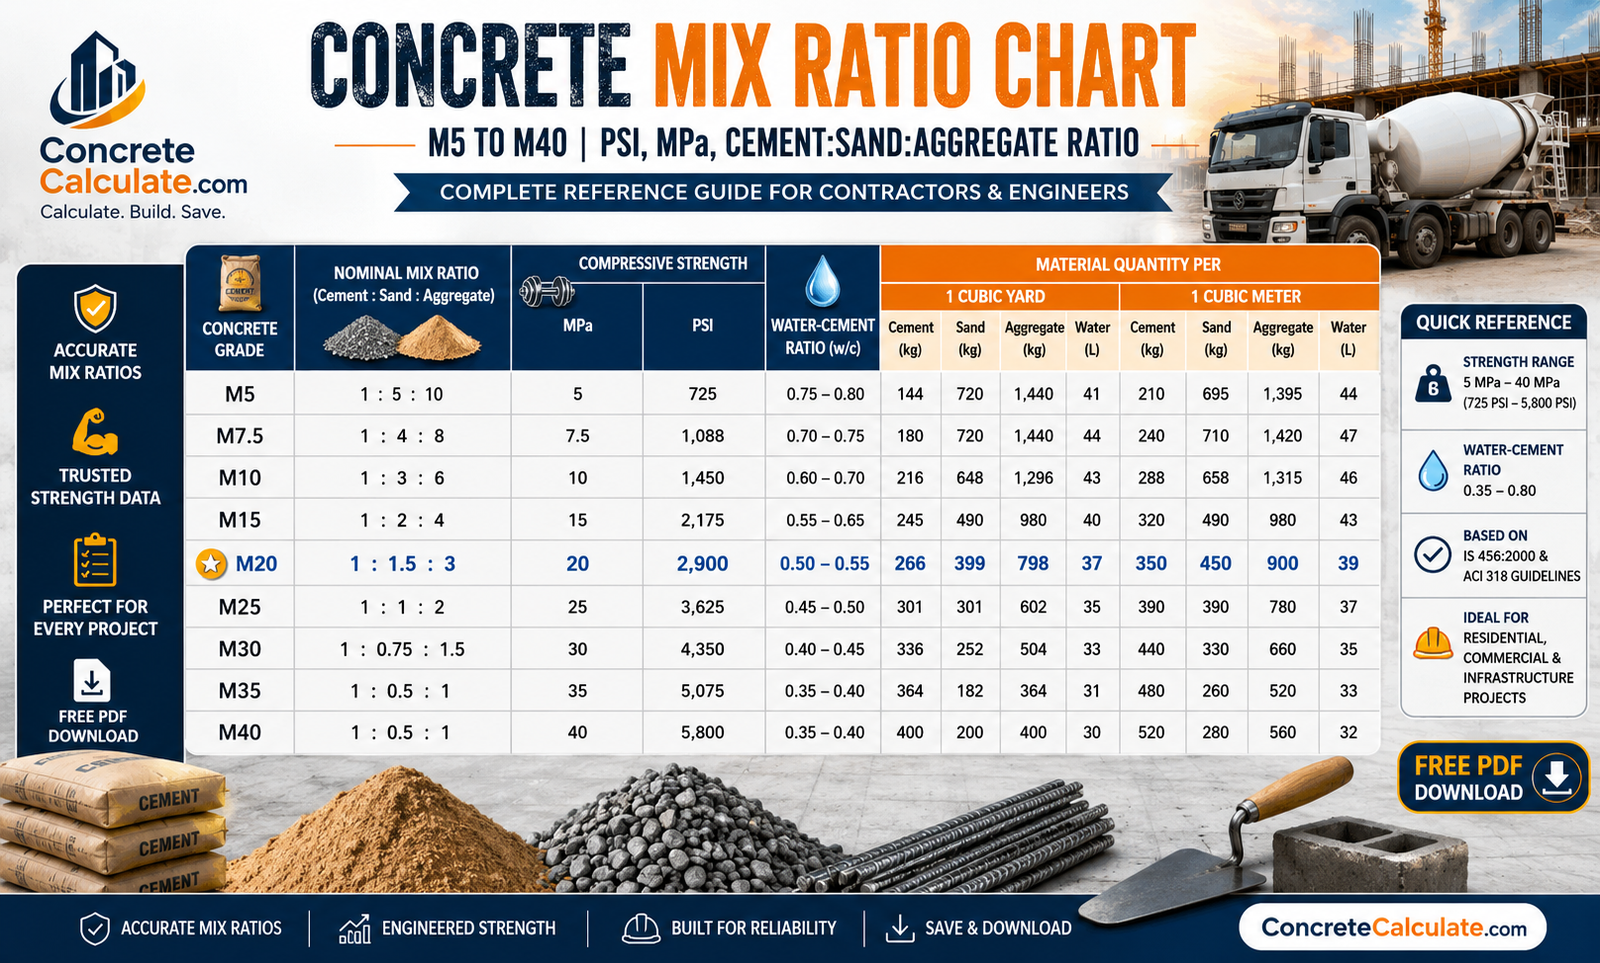
Concrete Mix Ratio Chart
M5 to M40 – Cement Sand Aggregate Ratio, PSI & MPa
The complete concrete mix ratio and cement sand aggregate ratio reference for contractors, engineers, and DIY builders — nominal mixes, compressive strength, water-cement ratio, and material quantities per cubic yard/meter.
 Reviewed by Muhammad Ramzan Babar, PhD Researcher (Plasma Physics) & Calculator Developer — View Profile
Master Concrete Mix Ratio Chart – M5 to M40
Cement : sand : aggregate ratio by volume, with compressive strength and typical applications for every standard concrete grade.
How to Read This Chart
The “M” number represents the characteristic compressive strength in MPa (N/mm²) at 28 days. Ratios shown are the cement:sand:aggregate ratio by volume for nominal mixes. For exact quantities on your specific project, use our Concrete Mix Ratio Calculator.
| Grade | Mix Ratio (C:S:A) | Strength (MPa) | Strength (PSI) | Mix Type | Typical Use |
|---|---|---|---|---|---|
| M5 | 1:5:10 | 5 | 725 | Nominal | Blinding, leveling course |
| M7.5 | 1:4:8 | 7.5 | 1,087 | Nominal | Foundation bedding, PCC |
| M10 | 1:3:6 | 10 | 1,450 | Nominal | Pathways, floor base, non-structural |
| M15 | 1:2:4 | 15 | 2,175 | Nominal | Foundations, flooring, mass concrete |
| M20 | 1:1.5:3 | 20 | 2,900 | Nominal | RCC slabs, beams, columns (residential) |
| M25 | 1:1:2 | 25 | 3,625 | Standard/Design | RCC for higher loads, commercial |
| M30 | Design Mix | 30 | 4,350 | Design | High-rise, heavy load structures |
| M35 | Design Mix | 35 | 5,075 | Design | Columns, industrial floors, bridges |
| M40 | Design Mix | 40 | 5,800 | Design | Heavy-duty structures, industrial buildings |
★ Highlighted rows (M15–M25) are most common in residential construction. Source: IS 456:2000, IS 10262:2019, ACI 318 guidance on nominal vs design mixes.
Concrete Grade to PSI & MPa Conversion Chart
Quick reference for converting between metric (MPa) and US customary (PSI) concrete strength units.
| Grade | MPa | PSI | US Equivalent Use |
|---|---|---|---|
| M10 | 10 | 1,450 | Sidewalks, non-structural fill |
| M15 | 15 | 2,175 | 2,000–2,500 PSI general use / footings |
| M20 | 20 | 2,900 | 3,000 PSI standard residential slabs/driveways |
| M25 | 25 | 3,625 | 3,500–4,000 PSI garage floors, driveways (cold climates) |
| M30 | 30 | 4,350 | 4,000+ PSI structural, footings for heavy loads |
| M35 | 35 | 5,075 | 5,000 PSI columns, industrial floors |
| M40 | 40 | 5,800 | 5,800+ PSI bridges, heavy structural elements |
Water-Cement Ratio Chart
Recommended water-cement (w/c) ratios by grade and exposure condition, per IS 456 and ACI 318.
| Grade | W/C Ratio (Normal Exposure) | W/C Ratio (Severe Exposure) | Maximum W/C |
|---|---|---|---|
| M10–M15 | 0.55–0.60 | 0.50–0.55 | 0.60 |
| M20 | 0.50–0.55 | 0.45–0.50 | 0.55 |
| M25 | 0.45–0.50 | 0.40–0.45 | 0.50 |
| M30 | 0.40–0.45 | 0.35–0.40 | 0.45 |
| M35–M40 | 0.35–0.40 | 0.30–0.35 | 0.40 |
Key Takeaway
Lower water-cement ratios increase strength and durability but reduce workability. Never exceed the maximum W/C ratio for the intended exposure condition, even if it makes mixing easier on site. Check your mix with our Water-Cement Ratio Calculator.
Cement Sand Aggregate Quantities Per Cubic Meter / Cubic Yard
Approximate cement, sand, aggregate, and water requirements by grade — useful for concrete material estimation and takeoff.
| Grade | Cement (kg/m³) | Sand (kg/m³) | Aggregate (kg/m³) | Water (L/m³) | Cement (lb/yd³) |
|---|---|---|---|---|---|
| M10 | 210 | 630 | 1,260 | 125 | 354 |
| M15 | 260 | 520 | 1,040 | 145 | 438 |
| M20 | 320 | 480 | 960 | 170 | 539 |
| M25 | 380 | 380 | 760 | 180 | 640 |
| M30 | 440 | 660 | 1,020 | 180 | 741 |
| M35 | 490 | 650 | 1,000 | 185 | 825 |
| M40 | 540 | 640 | 980 | 190 | 910 |
Conversion used: 1 m³ = 1.308 yd³. Cement lb/yd³ derived from kg/m³ × 2.2046 ÷ 1.308.
US Customary Mix Ratios (Bags per Yard)
How common nominal concrete mix ratios translate to bagged concrete on US job sites, using standard 94 lb (43 kg) cement bags.
| Mix Ratio | Nearest Grade | Cement Bags/yd³ (94 lb) | PSI (approx) | Common Use |
|---|---|---|---|---|
| 1:3:6 | M10 | 3.8 | 1,450 | Base course, non-structural |
| 1:2:4 | M15 | 4.7 | 2,175 | Footings, foundations |
| 1:1.5:3 | M20 | 5.8 | 2,900 | Driveways, slabs, sidewalks |
| 1:1:2 | M25 | 6.9 | 3,625 | Garage floors, heavy-duty slabs |
Nominal Mix vs Design Mix
Understanding when a fixed concrete mix ratio is acceptable and when a lab-designed mix is required.
| Aspect | Nominal Mix | Design Mix |
|---|---|---|
| Proportioning | Fixed volumetric ratio (e.g., 1:2:4) | Calculated for specific strength/durability |
| Grades | M5–M25 (occasionally M20) | M25 and above (mandatory M30+) |
| Testing Required | Minimal | Lab trial mixes, cube testing mandatory |
| Use Case | Small residential jobs, non-critical elements | Structural elements, high-rise, bridges |
Mix Ratio Formulas
Core formulas for converting cement sand aggregate ratio into real material quantities.
Visual Strength Comparison Chart
Relative compressive strength (PSI) across all standard concrete grades, at a glance.
Bar widths scaled relative to M40 (5,800 PSI = 100%). Use this visual to quickly compare relative strength between concrete grades.
Worked Contractor Examples
Real-world concrete mix ratio calculations for common job scenarios.
10 ft × 10 ft × 4 in Driveway Slab (M20)
Foundation Footing (M15, 1:2:4)
Frequently Asked Questions
📥 Download Concrete Mix Ratio Chart PDF
Use your browser’s print function to instantly save this page as a PDF. This avoids broken file links and gives you an always up-to-date printable version for jobsite binders, estimating folders, and contractor reference kits.