Pipe Volume Chart 2026 – Gallons per Foot & Capacity
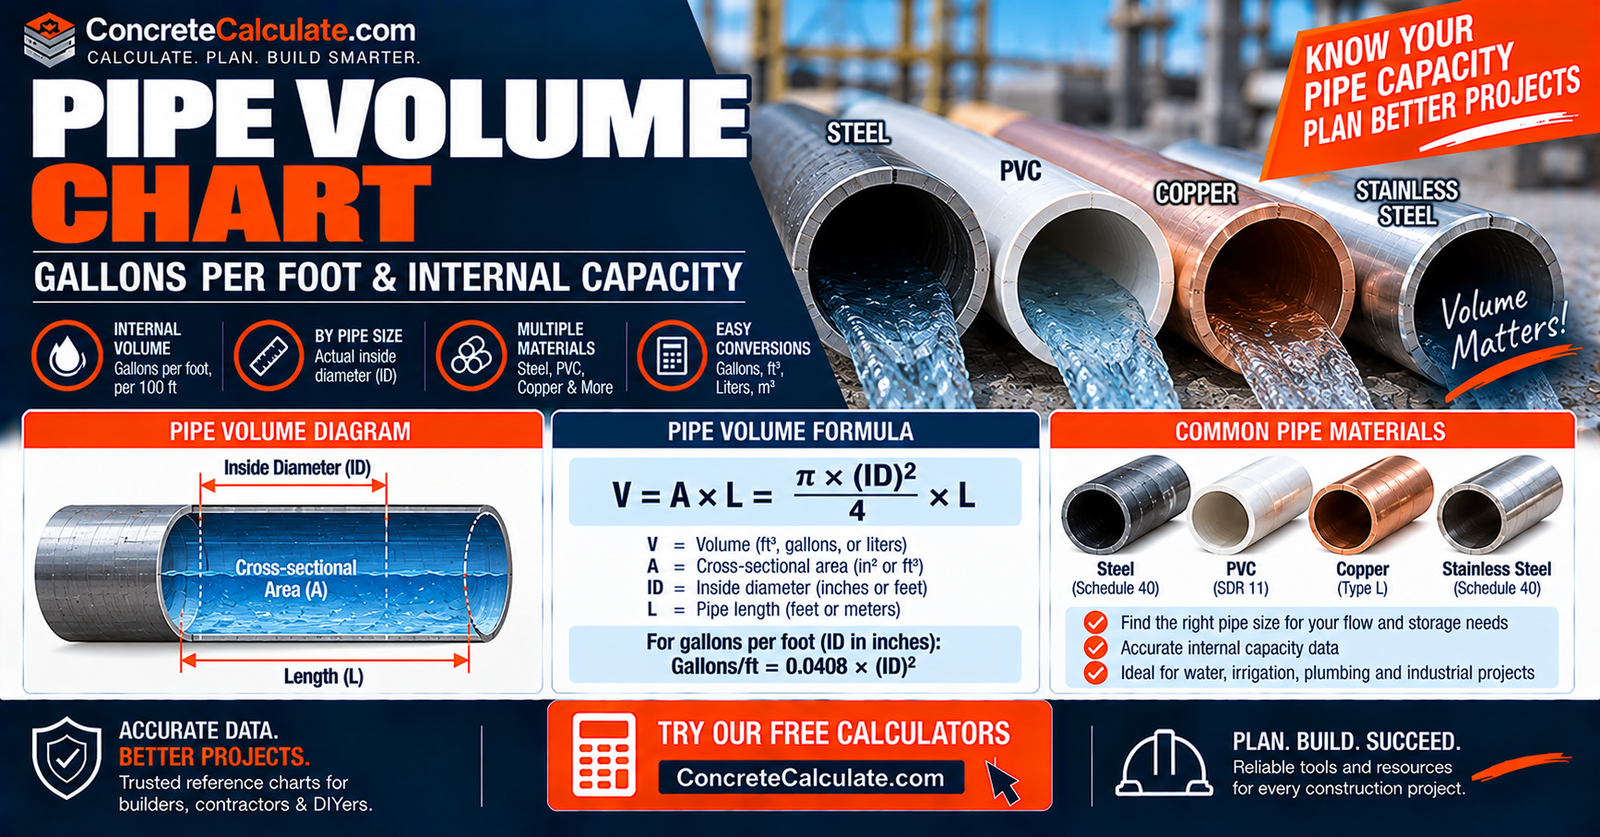
Pipe Volume Chart
Gallons per Foot & Capacity
Internal pipe capacity in gallons per foot, per 100 ft, cubic feet, and liters by actual inside diameter for Schedule 40, Schedule 80, PVC, and copper pipe.
 Reviewed by Muhammad Ramzan Babar, PhD Researcher (Plasma Physics) & Calculator Developer, View Profile
These figures represent internal capacity, not flow rate, pressure rating, or pipe weight
Pipe volume is based on actual inside diameter, not nominal pipe size and not outside diameter. Two pipes with the same NPS can hold different amounts of water if their schedules differ. For how fast fluid moves through a pipe, see the separate Pipe Flow Rate Chart.
Pipe Volume Chart, Quick Reference
Internal capacity using actual Schedule 40 inside diameter, the size most U.S. plumbing and mechanical searches need first.
Schedule 40 Pipe Volume per Foot
| NPS (in) | Actual ID (in) | gal/ft | ft³/ft | L/ft | gal/10 ft | gal/100 ft |
|---|---|---|---|---|---|---|
| 1/2 | 0.622 | 0.0158 | 0.0021 | 0.0598 | 0.158 | 1.58 |
| 3/4 | 0.824 | 0.0277 | 0.0037 | 0.1049 | 0.277 | 2.77 |
| 1 | 1.049 | 0.0449 | 0.0060 | 0.1699 | 0.449 | 4.49 |
| 2 | 2.067 | 0.1743 | 0.0233 | 0.6598 | 1.743 | 17.43 |
| 3 | 3.068 | 0.3840 | 0.0513 | 1.4536 | 3.840 | 38.40 |
| 4 | 4.026 | 0.6613 | 0.0884 | 2.5033 | 6.613 | 66.13 |
| 6 | 6.065 | 1.5008 | 0.2005 | 5.6791 | 15.008 | 150.08 |
| 8 | 7.981 | 2.5988 | 0.3473 | 9.8339 | 25.988 | 259.88 |
Values calculated from ASME B36.10-2022 Schedule 40 inside diameters using 1 US gallon = 231 in³. For the actual bore dimensions behind these values, see the Pipe Inside Diameter Chart.
Important Note
These figures represent internal pipe capacity. They do not indicate flow rate, pressure rating, or pipe weight. Each of those is a separate property covered on its own dedicated chart.
What Is Pipe Volume?
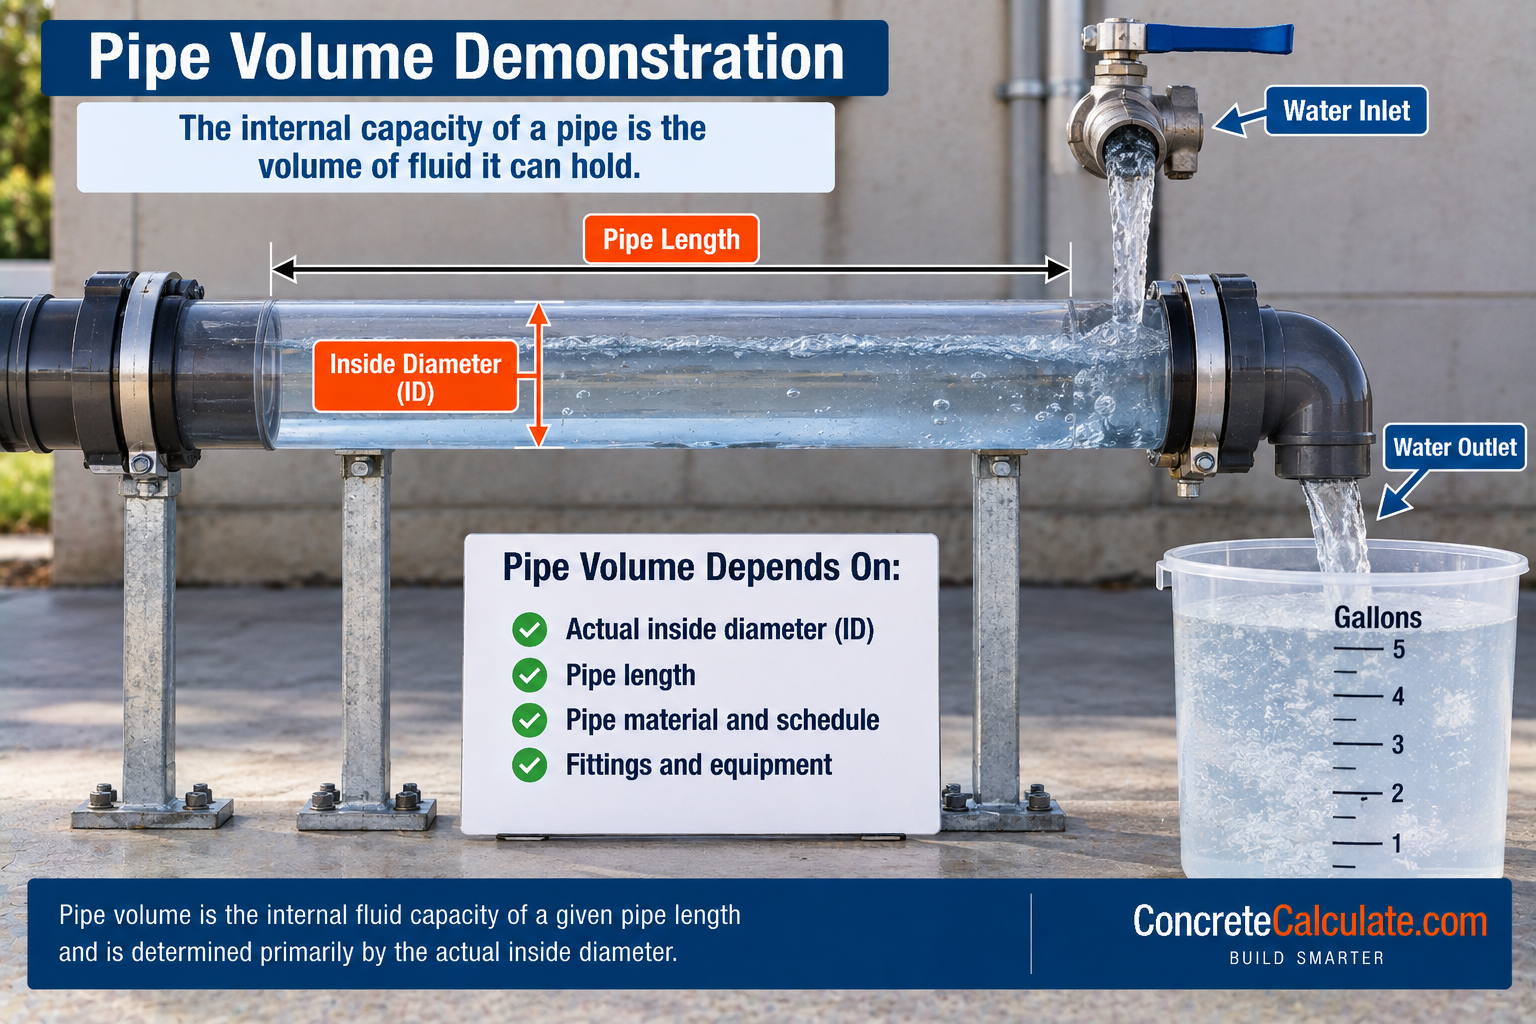
The internal space available to contain water, fluid, gas, or other material within a given length of pipe.
| Unit | Common Use |
|---|---|
| Gallons per foot | Primary U.S. unit for this chart |
| Gallons per 100 ft | Convenient scale for longer runs |
| Cubic feet | Useful for air, gas, and larger process piping |
| Cubic inches | Intermediate calculation unit |
| Liters per foot / meter | Metric reference |
| Cubic meters | Metric reference for larger systems |
Pipe Volume vs Pipe Flow Rate
An important distinction, since these two concepts are frequently confused.
| Term | Meaning | Units |
|---|---|---|
| Pipe Volume | Amount of fluid physically contained in a specified length | gal, ft³, L |
| Flow Rate | Amount of fluid moving past a point per unit time | GPM, L/min, m³/h |
Key Message
A 100-ft pipe may contain 100 gallons without having a flow rate of 100 GPM. Volume and flow rate are entirely different quantities related only by how long it takes to fill or empty the pipe. See the Pipe Flow Rate Chart for GPM by pipe size and velocity.
Pipe Volume vs Pipe Capacity
Two terms often used interchangeably in search intent.
For this chart, capacity refers to the internal geometric volume of the pipe bore. This is distinct from maximum hydraulic flow capacity (covered in the Pipe Flow Rate Chart), pressure capacity (covered in the Pipe Pressure Rating Chart), and storage-tank usable capacity, which involves separate tank-specific geometry and fill considerations.
Pipe Volume Formula
The core equation behind every table on this page.
Formula
V = AL, where A = (π/4)ID². Therefore V = (πID²L)/4, where ID is inside diameter and L is pipe length.
How to Calculate Gallons per Foot
Probably the single most useful formula on this page.
Formula
With ID in inches and length = 1 ft: V(in³/ft) = (π/4)ID² × 12. Since 1 US gallon = 231 in³, this simplifies to gal/ft ≈ 0.0408 × ID².
Example: NPS 2 Schedule 40
Why Inside Diameter Controls Pipe Volume
Volume is proportional to the square of inside diameter.
Because V is proportional to ID², even a modest change in ID can noticeably alter pipe capacity. This is why schedule matters so much for volume calculations; see the Pipe Inside Diameter Chart for the full actual-bore reference by schedule.
Nominal Pipe Size vs Actual Internal Volume
Do not calculate volume from NPS directly.
Example: NPS 2 Schedule 40
NPS = 2 in, but the actual ID is approximately 2.067 in. Using exactly 2.000 in would give the wrong capacity. ASME B36.10-2022 standardizes the dimensional framework from which the correct nominal ID must be derived before calculating volume.
Schedule 40 Pipe Volume Chart
The main volume chart, covering the full common commercial range.
| NPS (in) | ID (in) | gal/ft | gal/10 ft | gal/20 ft | gal/100 ft | L/m |
|---|---|---|---|---|---|---|
| 1/2 | 0.622 | 0.0158 | 0.158 | 0.316 | 1.58 | 0.196 |
| 3/4 | 0.824 | 0.0277 | 0.277 | 0.554 | 2.77 | 0.344 |
| 1 | 1.049 | 0.0449 | 0.449 | 0.898 | 4.49 | 0.558 |
| 1-1/4 | 1.380 | 0.0777 | 0.777 | 1.554 | 7.77 | 0.965 |
| 1-1/2 | 1.610 | 0.1058 | 1.058 | 2.116 | 10.58 | 1.313 |
| 2 | 2.067 | 0.1743 | 1.743 | 3.486 | 17.43 | 2.165 |
| 2-1/2 | 2.469 | 0.2487 | 2.487 | 4.974 | 24.87 | 3.089 |
| 3 | 3.068 | 0.3840 | 3.840 | 7.680 | 38.40 | 4.769 |
| 4 | 4.026 | 0.6613 | 6.613 | 13.226 | 66.13 | 8.213 |
| 5 | 5.047 | 1.0393 | 10.393 | 20.786 | 103.93 | 12.907 |
| 6 | 6.065 | 1.5008 | 15.008 | 30.016 | 150.08 | 18.639 |
| 8 | 7.981 | 2.5988 | 25.988 | 51.976 | 259.88 | 32.275 |
| 10 | 10.020 | 4.0963 | 40.963 | 81.926 | 409.63 | 50.873 |
| 12 | 11.938 | 5.8146 | 58.146 | 116.292 | 581.46 | 72.214 |
Schedule 80 Pipe Volume Chart
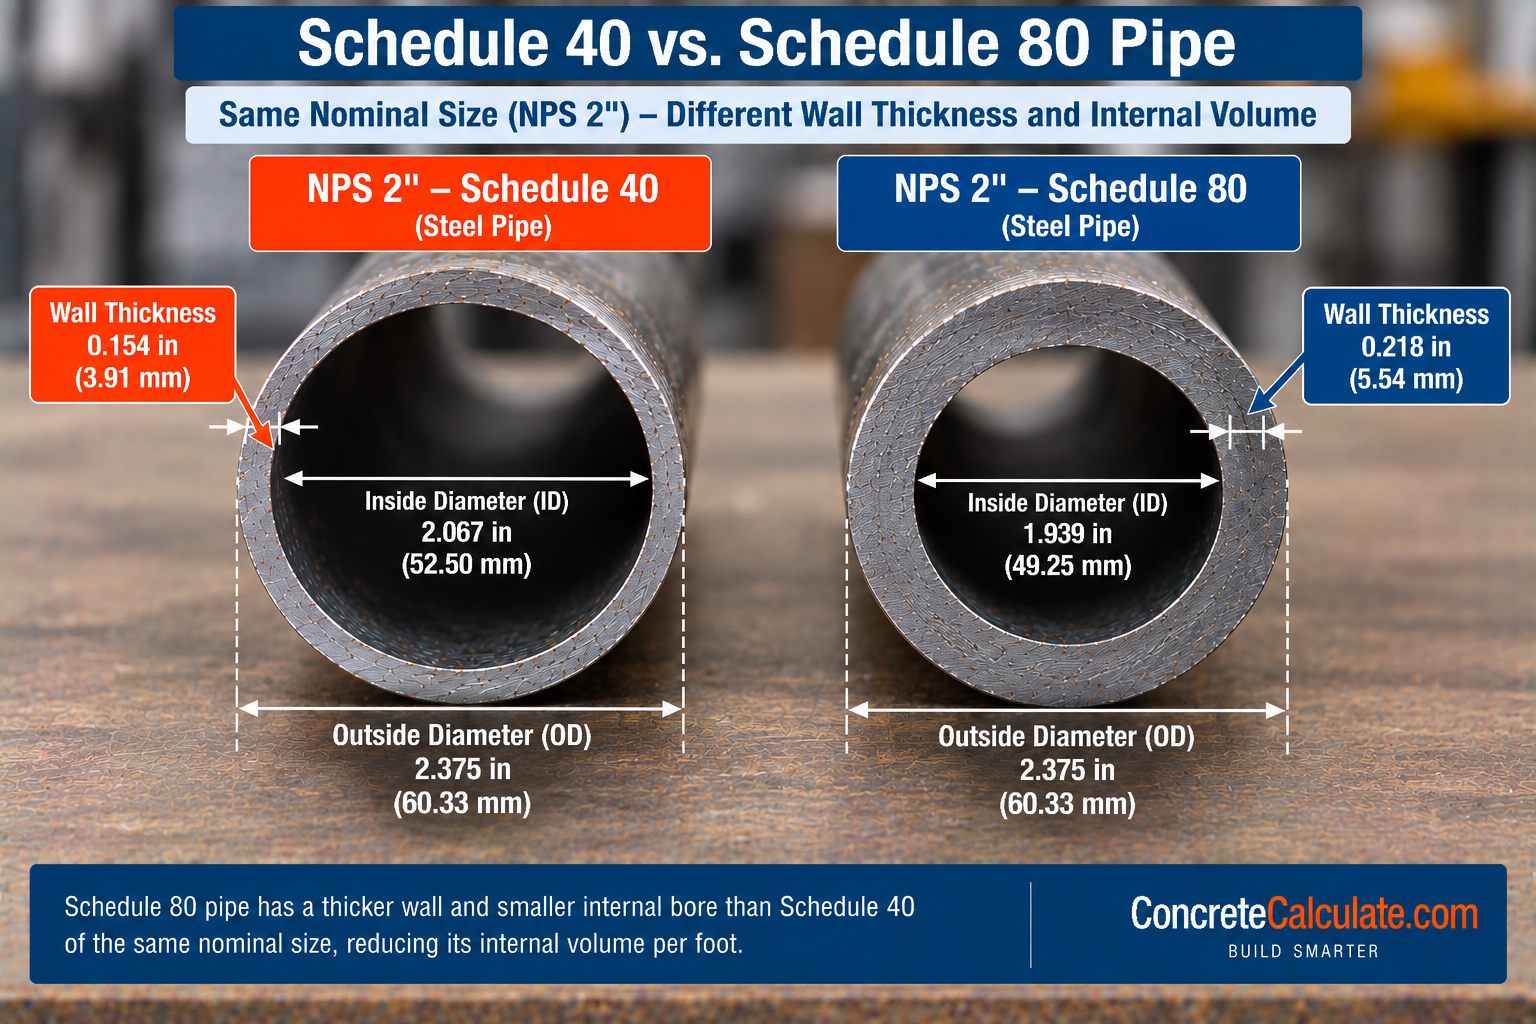
Schedule 80 normally holds less fluid per foot than Schedule 40 of the same nominal size because it has a thicker wall and smaller ID.
| NPS (in) | Sch 80 ID (in) | gal/ft | gal/20 ft | gal/100 ft |
|---|---|---|---|---|
| 1/2 | 0.546 | 0.0122 | 0.244 | 1.22 |
| 3/4 | 0.742 | 0.0225 | 0.450 | 2.25 |
| 1 | 0.957 | 0.0374 | 0.748 | 3.74 |
| 1-1/2 | 1.500 | 0.0918 | 1.836 | 9.18 |
| 2 | 1.939 | 0.1534 | 3.068 | 15.34 |
| 3 | 2.900 | 0.3431 | 6.862 | 34.31 |
| 4 | 3.826 | 0.5972 | 11.944 | 59.72 |
| 6 | 5.761 | 1.3541 | 27.082 | 135.41 |
| 8 | 7.625 | 2.3721 | 47.442 | 237.21 |
Charlotte Pipe’s Schedule 80 products retain the same outside diameter as Schedule 40 at each nominal size but use a thicker wall (for example, 0.147 in versus 0.109 in at 1/2-inch nominal), confirming the smaller-bore relationship shown here.
Schedule 40 vs Schedule 80 Pipe Volume
One of the strongest comparison sections on this page.
| NPS (in) | Sch 40 ID | Sch 80 ID | Sch 40 gal/ft | Sch 80 gal/ft | Capacity Difference |
|---|---|---|---|---|---|
| 1 | 1.049 | 0.957 | 0.0449 | 0.0374 | 0.0075 gal/ft |
| 2 | 2.067 | 1.939 | 0.1743 | 0.1534 | 0.0209 gal/ft |
| 4 | 4.026 | 3.826 | 0.6613 | 0.5972 | 0.0641 gal/ft |
| 6 | 6.065 | 5.761 | 1.5008 | 1.3541 | 0.1467 gal/ft |
Same OD, thicker wall, smaller ID, lower volume: this is the direct chain of cause and effect from schedule to internal capacity.
Schedule 10 and Heavy-Wall Pipe Volume
Thinner-wall and heavier-wall schedules at the opposite ends of the capacity spectrum.
| NPS (in) | Sch 10 ID (in) | Sch 10 gal/ft | Sch 160 ID (in) | Sch 160 gal/ft |
|---|---|---|---|---|
| 1/2 | 0.674 | 0.0185 | 0.466 | 0.0089 |
| 2 | 2.157 | 0.1898 | 1.687 | 0.1162 |
| 4 | 4.260 | 0.7404 | 3.438 | 0.4820 |
| 6 | 6.357 | 1.6488 | 5.189 | 1.0985 |
For many sizes, Schedule 10 has a larger bore than Schedule 40, so it holds more fluid per foot. Not every schedule exists for every NPS or material; verify availability with the Pipe Schedule Chart before assuming a product exists.
How Pipe Schedule Affects Internal Volume
The full chain of dependency, from schedule to capacity.
Schedule → Wall Thickness → ID → Internal Area → Volume
Each step in this chain depends on the previous one. Changing schedule changes wall thickness, which changes inside diameter, which changes internal area, which finally changes volume. See the Pipe Schedule Chart and Pipe Wall Thickness Chart for the earlier links in this chain.
Pipe Wall Thickness vs Internal Capacity
A nonlinear relationship because ID is squared in the volume formula.
Formula
For fixed OD: ID = OD – 2t, and V = (π(OD – 2t)²/4)L. Because ID is squared, wall thickness influences volume nonlinearly rather than in direct proportion.
ASME B36.10-2022 Steel Pipe Volume Basis
The correct workflow for deriving volume from a dimensional standard.
ASME B36.10-2022 provides standardized dimensions for welded and seamless wrought steel pipe. The correct workflow is to obtain NPS, obtain OD, obtain the schedule wall thickness, calculate ID = OD – 2t, and then calculate internal volume from that derived ID. ASME B36.10 is a dimensional standard; internal volume is calculated from those nominal dimensions rather than treated as a separate pressure or capacity rating within the standard itself.
✓ Verified Against ASME B36.10-2022Stainless Steel Pipe Volume Chart
ASME B36.19-2022 is the dimensional reference for stainless pipe volume.
| NPS (in) | 10S ID | 10S gal/ft | 40S ID | 40S gal/ft | 80S ID | 80S gal/ft |
|---|---|---|---|---|---|---|
| 1/2 | 0.674 | 0.0185 | 0.622 | 0.0158 | 0.546 | 0.0122 |
| 2 | 2.157 | 0.1898 | 2.067 | 0.1743 | 1.939 | 0.1534 |
| 4 | 4.260 | 0.7404 | 4.026 | 0.6613 | 3.826 | 0.5972 |
ASME B36.19-2022 covers welded and seamless wrought stainless pipe dimensions using the same basic NPS framework as B36.10.
Schedule 40 vs 40S and 80 vs 80S Volume
A dedicated warning worth repeating for volume calculations specifically.
Do Not Copy a Schedule 40 Volume Table Into a 40S Table for Every Size
ASME B36.19 specifically states that certain 10S, 40S, and 80S wall thicknesses differ from corresponding B36.10 dimensions at selected larger NPS values. Different wall means different ID, which means different capacity, so 40 and 40S, or 80 and 80S, should not be assumed identical at every size.
Pipe Volume per Foot Chart
An ID-based lookup, useful for custom tubing, nonstandard pipe, and field-measured bores.
| Pipe ID (in) | gal/ft | ft³/ft | L/ft |
|---|---|---|---|
| 0.5 | 0.0102 | 0.00136 | 0.0386 |
| 1.0 | 0.0408 | 0.00545 | 0.1544 |
| 1.5 | 0.0918 | 0.01227 | 0.3474 |
| 2.0 | 0.1632 | 0.02182 | 0.6176 |
| 3.0 | 0.3672 | 0.04909 | 1.3894 |
| 4.0 | 0.6528 | 0.08727 | 2.4704 |
Equipment for Your Project
Affiliate disclosure: As an Amazon Associate, ConcreteCalculate earns from qualifying purchases. We may also earn a commission from other affiliate links at no additional cost to you.
Pipe Volume per 10 ft, 20 ft, and 100 ft
A practical contractor chart for flushing, filling, chemical treatment, hydrotesting, winterizing, and draining.
| Pipe Size (in) | gal/ft | 10 ft (gal) | 20 ft (gal) | 100 ft (gal) |
|---|---|---|---|---|
| 1/2 | 0.0158 | 0.158 | 0.316 | 1.58 |
| 1 | 0.0449 | 0.449 | 0.898 | 4.49 |
| 2 | 0.1743 | 1.743 | 3.486 | 17.43 |
| 4 | 0.6613 | 6.613 | 13.226 | 66.13 |
Pipe Volume in Cubic Feet
Useful for air, gas, and larger process piping.
Formula
ft³ = in³ ÷ 1728, or calculate directly from dimensions already in feet.
| Pipe Size (in) | ft³/ft | ft³/100 ft |
|---|---|---|
| 2 | 0.0233 | 2.33 |
| 4 | 0.0884 | 8.84 |
| 6 | 0.2005 | 20.05 |
Do not confuse this physical cubic-foot volume with standard cubic feet of compressed gas, which is a separate gas-specific measurement convention.
Pipe Volume in Gallons
The primary U.S. conversion and one of the article’s most practical sections.
Formula
1 US gal = 231 in³. Gallons/ft, gallons/10 ft, and gallons/100 ft are all derived from this same conversion applied to the calculated in³/ft value.
Pipe Volume in Liters and Cubic Meters
Metric equivalents kept as a secondary but complete reference.
| Pipe Size (in) | L/m | L/10 m | m³/100 m |
|---|---|---|---|
| 2 | 2.165 | 21.65 | 0.2165 |
| 4 | 8.213 | 82.13 | 0.8213 |
| 6 | 18.639 | 186.39 | 1.8639 |
Conversions: 1 US gallon ≈ 3.7854 L, and 1 m³ = 1,000 L.
How to Calculate Total Volume From Pipe Length
The quick calculation workflow for a known run length.
Formula
V(total) = V(per length) × L.
Example: 250 ft of NPS 2 Schedule 40
Total Pipe Volume for Multiple Pipe Sizes
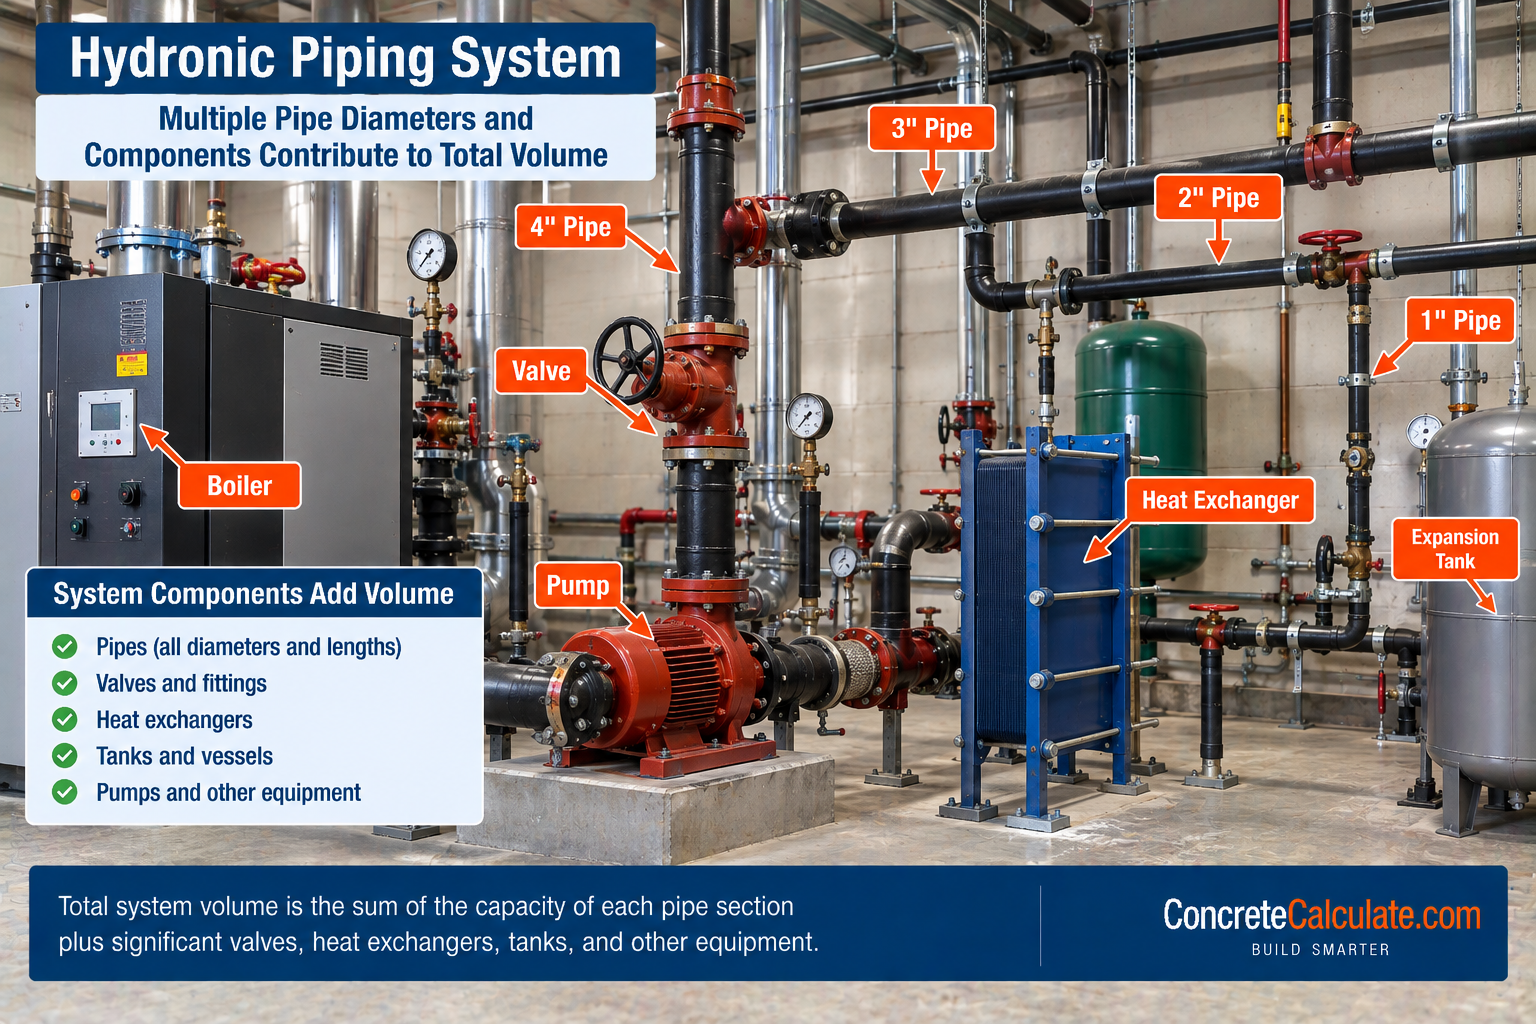
Very practical for hydronic loops, chemical treatment, glycol systems, and flushing.
Formula
V(system) = V1 + V2 + V3 + …
Example: Mixed-Size System
Fittings, Valves, and Equipment Volume
The straight-pipe chart does not include everything connected to it.
The straight-pipe chart does not include the internal volume of elbows, tees, valves, strainers, heat exchangers, pumps, tanks, or boilers. For precise system-volume calculations: V(system) = V(pipe) + V(fittings/equipment). Use manufacturer data for significant components rather than estimating their internal volume from pipe formulas.
Water Weight From Pipe Volume
A useful crossover with the Pipe Weight Chart.
Formula
W(water) = V(gal) × ρ(water). At typical room conditions, water weighs roughly 8.3 to 8.34 lb per US gallon depending on temperature. Then W(operating) = W(pipe) + W(contained water).
For pipe self-weight and operating weight tables, see the Pipe Weight Chart and Steel Pipe Weight Chart.
Filled Pipe Volume vs Filled Pipe Weight
A distinction that prevents another common misunderstanding.
| Property | Determined By |
|---|---|
| Volume | Geometry (inside diameter and length) |
| Fluid Weight | Fluid density |
Two pipes with identical ID and length contain the same volume, but if one contains water and another contains a denser fluid, the contained weight differs even though the volume is identical.
PVC Pipe Volume Chart
A supporting material section using current manufacturer dimensions.
| Nominal Size (in) | Sch 40 ID (in) | gal/ft |
|---|---|---|
| 1/2 | 0.622 | 0.0158 |
| 3/4 | 0.824 | 0.0277 |
| 1 | 1.049 | 0.0449 |
| 2 | 2.067 | 0.1743 |
| 4 | 4.026 | 0.6613 |
| 6 | 6.065 | 1.5008 |
| 8 | 7.981 | 2.5988 |
These IDs match published Schedule 40 PVC product dimensions from IPS-based pressure pipe manufacturers and can be used directly with the gallons-per-foot formula. For complete PVC-specific dimensional data, see the PVC Pipe Size Chart.
Schedule 40 vs Schedule 80 PVC Volume
Same nominal OD family, thicker walls for Schedule 80.
Manufacturer product data confirm the same pattern seen in steel: 1/2-inch nominal Schedule 40 PVC uses an OD of 0.840 in with a 0.109-in wall, while 1/2-inch Schedule 80 PVC keeps the same 0.840-in OD but increases the wall to 0.147 in. Therefore Schedule 80 PVC has less internal capacity per foot than Schedule 40 PVC of the same nominal size. The full PVC-specific dataset is maintained on the dedicated PVC Pipe Size Chart.
Copper Pipe/Tube Volume Chart
Copper Development Association published volume-per-linear-foot data.
| Nominal Size (in) | ft³/ft | gal/ft |
|---|---|---|
| 1-1/4 | 0.00917 | 0.0686 |
| 1-1/2 | 0.01300 | 0.0971 |
| 2 | 0.02270 | 0.1700 |
| 3 | 0.05010 | 0.3750 |
| 4 | 0.08060 | 0.6030 |
| 6 | 0.19400 | 1.4500 |
| 8 | 0.34100 | 2.5500 |
These are DWV copper tube values published directly by the Copper Development Association, not derived from steel schedule tables. For complete copper dimensional data by type, see the Copper Pipe Size Chart.
Type K vs L vs M Copper Volume
Wall thickness differences drive volume differences across copper tube types.
For the same nominal copper tube size, Type K has the thickest common wall and therefore the smallest ID and lowest volume per foot. Type L is intermediate, and Type M, with a thinner wall, has a larger ID and greater volume per foot. Use Copper Development Association dimension and volume tables rather than steel schedule data, since the Copper Tube Handbook treats copper tube dimensions and volume separately from steel NPS conventions.
How to Measure and Calculate Actual Pipe Volume
A field procedure for real installed systems.
Field Volume Workflow
Common Pipe Volume Chart Mistakes
Using nominal pipe size as actual ID
NPS is a label, not the actual bore dimension used for volume.
Using OD in the internal-volume formula
Only the internal bore contains fluid; OD includes the wall material.
Forgetting wall thickness
Wall thickness reduces the bore available for fluid.
Forgetting wall is present on both sides
Using ID = OD – t instead of ID = OD – 2t understates wall’s effect.
Ignoring schedule
Volume changes significantly with wall thickness at the same NPS.
Assuming Schedule 40 and 80 hold the same volume
Schedule 80’s smaller ID reduces capacity for the same NPS.
Confusing pipe volume with pipe flow rate
Volume is contained gallons; flow rate is gallons moving per minute.
Confusing gallons per foot with GPM
These use the same unit name but describe entirely different quantities.
Confusing pipe capacity with pressure rating
Internal volume and allowable pressure are separate properties.
Using steel pipe IDs for copper tube
Copper uses its own dimensional and volume system entirely.
Using steel dimensions for PVC without checking the product
PVC follows its own governing product standard and manufacturer data.
Assuming 40S and 40 have identical volumes at every size
Some sizes have different wall thickness and therefore different capacity.
Assuming 80S and 80 are universally identical
The same caution applies to Schedule 80 versus 80S at certain sizes.
Ignoring fittings and equipment in system capacity
Elbows, valves, and equipment add volume beyond straight pipe.
Ignoring liners
Internal linings reduce the effective bore and available capacity.
Ignoring corrosion and scale
Effective in-service volume can be smaller than the nominal chart value.
Treating nominal calculated capacity as exact field volume
Manufacturing tolerances mean actual volume can differ slightly.
Confusing cubic feet with gallons
Always confirm which unit a published value actually uses.
Forgetting to multiply gallons per foot by total length
Per-foot values are only a starting point for a length-specific total.
Using the total outer cylinder volume instead of bore volume
Only the internal space, not the whole pipe cylinder, holds fluid.
Using water weight as though it were water volume
Weight and volume are related by density, not interchangeable directly.
Pipe Volume Chart Limitations
Read Before Using for Process Inventory or System Design
Pipe volume is based on inside diameter; NPS is not the bore diameter. Schedule changes ID and therefore volume. Reference values in this chart are based on nominal dimensions, and actual volume can differ due to manufacturing tolerances. Stainless S schedules can differ from corresponding steel schedules at certain sizes. PVC dimensions should follow the applicable product standard and manufacturer data. Copper uses a separate tube-sizing system entirely. Linings, scale, and corrosion can reduce effective volume over time. Straight-pipe charts exclude fittings and equipment volume. Flow rate and pressure capacity are separate properties from internal volume. Critical chemical or process inventory calculations should use project-specific as-built dimensions and manufacturer data rather than this general reference chart alone.
Frequently Asked Questions
Download Pipe Volume Chart PDF
Save or print this reference including the Schedule 40 and Schedule 80 gallons-per-foot tables, the volume formula, PVC and copper capacity data, and the multi-size system calculation workflow.