Concrete Strength Gain Chart – Timeline & PSI Reference
Concrete Strength Gain Chart
Timeline & PSI Reference
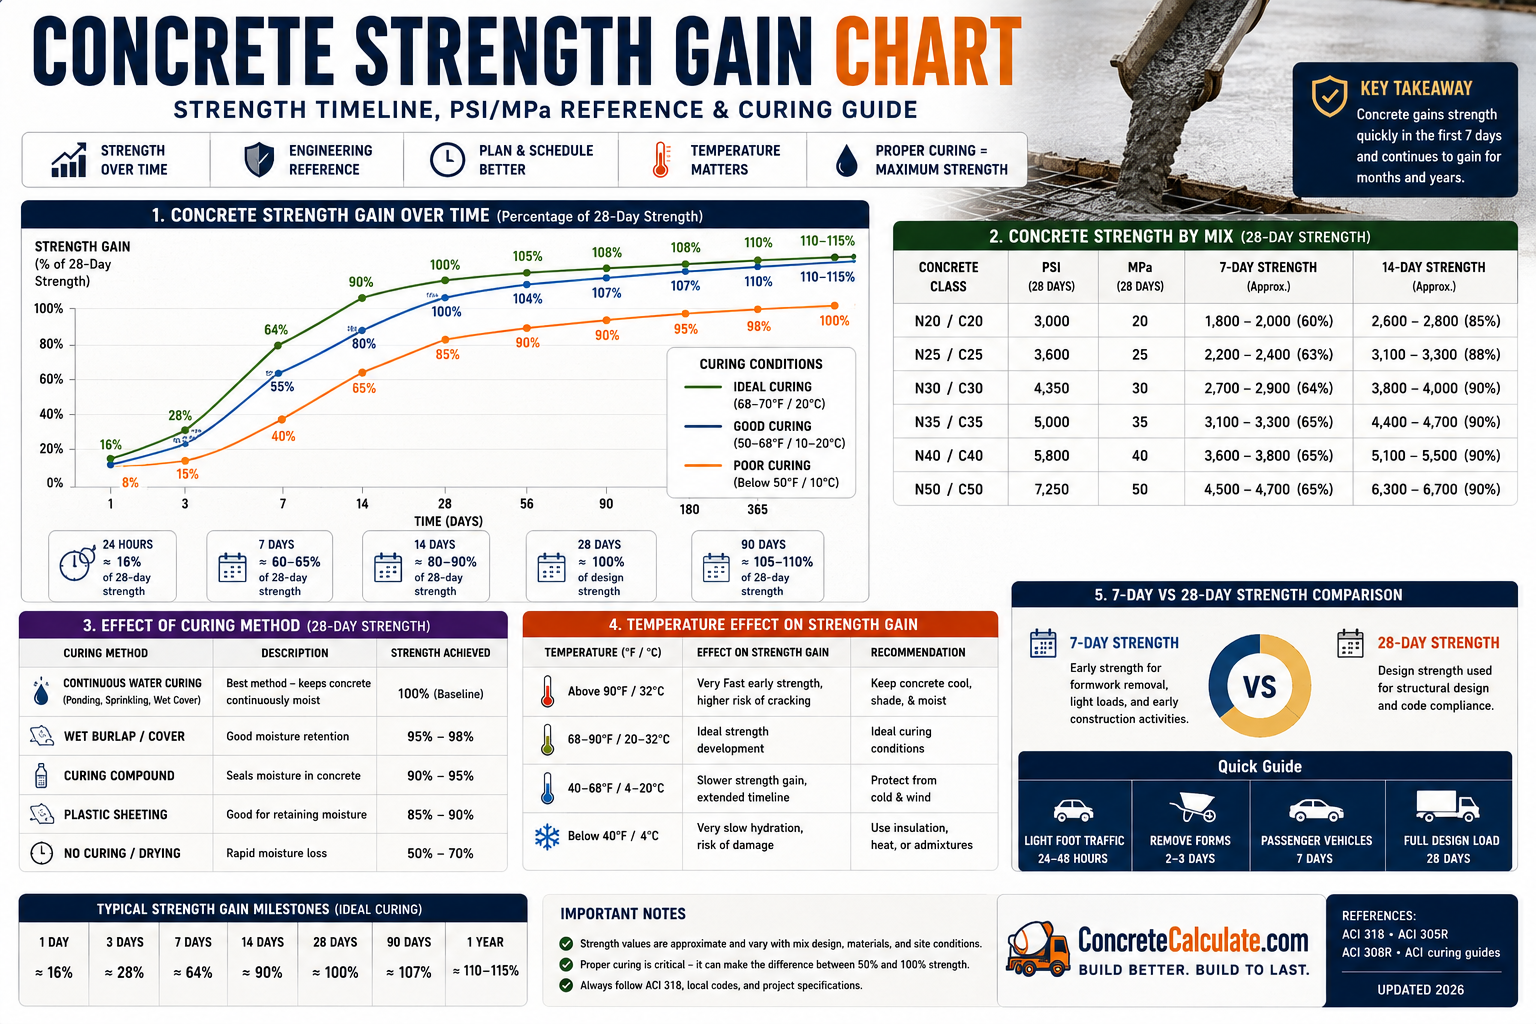
The complete concrete strength gain reference — timeline percentages, PSI/MPa/grade tables, curing methods, and temperature effects.
 Reviewed by Muhammad Ramzan Babar, PhD Researcher (Plasma Physics) & Calculator Developer — View Profile
⭐ Master Concrete Strength Gain Chart
Complete reference showing percentage of design strength achieved over time under standard curing conditions (~68-70°F, moist cured).
How to Read This Chart
Percentages represent typical Type I Portland cement concrete under standard moist curing. Actual results vary with mix design, cement type, and temperature. Verify your mix with our Concrete PSI Strength Calculator.
| Age | % of 28-Day Design Strength | Status |
|---|---|---|
| 8 Hours | ~2% | Initial set only |
| 24 Hours | ~16% | Walking possible (light traffic) |
| 3 Days | ~40% | Form removal typical |
| 7 Days | ~65% | Vehicle traffic generally safe |
| 14 Days | ~90% | Approaching design strength |
| 28 Days | 100% | Design/testing benchmark |
| 56 Days | ~105% | Continued gain |
| 90 Days | ~110% | Long-term strength plateau begins |
Source: standard Type I Portland cement strength development curve, widely referenced across ACI and engineering literature [web:240].
⭐ Concrete Strength Gain Timeline Chart
Detailed hour-by-hour and day-by-day strength percentages for standard curing conditions.
| Age | Approximate Strength (%) |
|---|---|
| 8 Hours | ~2% |
| 12 Hours | ~4% |
| 24 Hours | ~16% |
| 3 Days | ~40% |
| 7 Days | ~65% |
| 14 Days | ~90% |
| 21 Days | ~97% |
| 28 Days | 100% |
| 56 Days | ~105% |
| 90 Days | ~110% |
Concrete Strength Gain by PSI
Strength development in actual PSI values for common design strengths at key testing ages.
| Design Strength | 1 Day | 3 Days | 7 Days | 14 Days | 28 Days |
|---|---|---|---|---|---|
| 3000 PSI | 480 | 1,200 | 1,950 | 2,700 | 3,000 |
| 3500 PSI | 560 | 1,400 | 2,275 | 3,150 | 3,500 |
| 4000 PSI | 640 | 1,600 | 2,600 | 3,600 | 4,000 |
| 4500 PSI | 720 | 1,800 | 2,925 | 4,050 | 4,500 |
| 5000 PSI | 800 | 2,000 | 3,250 | 4,500 | 5,000 |
| 6000 PSI | 960 | 2,400 | 3,900 | 5,400 | 6,000 |
Values are proportional estimates applying standard percentage-of-design-strength curves. Verify your specific mix with our Mix Design Calculator.
Concrete Strength Gain by MPa
Metric equivalent strength development table for international projects.
| Design Strength | 1 Day | 3 Days | 7 Days | 14 Days | 28 Days |
|---|---|---|---|---|---|
| 20 MPa | 3.2 | 8.0 | 13.0 | 18.0 | 20.0 |
| 25 MPa | 4.0 | 10.0 | 16.3 | 22.5 | 25.0 |
| 30 MPa | 4.8 | 12.0 | 19.5 | 27.0 | 30.0 |
| 35 MPa | 5.6 | 14.0 | 22.8 | 31.5 | 35.0 |
| 40 MPa | 6.4 | 16.0 | 26.0 | 36.0 | 40.0 |
| 50 MPa | 8.0 | 20.0 | 32.5 | 45.0 | 50.0 |
Strength Gain by Concrete Grade
Indian/international grade designations with corresponding strength values.
| Grade | Design Strength | 7-Day Strength | 28-Day Strength |
|---|---|---|---|
| M10 | 10 MPa | 6.5 MPa | 10 MPa |
| M15 | 15 MPa | 9.75 MPa | 15 MPa |
| M20 | 20 MPa | 13 MPa | 20 MPa |
| M25 | 25 MPa | 16.25 MPa | 25 MPa |
| M30 | 30 MPa | 19.5 MPa | 30 MPa |
| M35 | 35 MPa | 22.75 MPa | 35 MPa |
| M40 | 40 MPa | 26 MPa | 40 MPa |
| M50 | 50 MPa | 32.5 MPa | 50 MPa |
⭐ Concrete Strength Gain by Curing Method
Curing method directly affects how much strength concrete actually achieves versus its theoretical potential.
| Curing Method | Effect on Strength Development |
|---|---|
| Water Curing | Best results; continuous moisture supports full hydration, often 100%+ of potential strength |
| Wet Burlap | Very effective if kept consistently damp; near-optimal strength gain |
| Plastic Sheeting | Good moisture retention, no added water; reliable for most slabs |
| Curing Compound | Convenient, seals in moisture; slightly lower ultimate strength than wet curing |
| Steam Curing | Accelerates early strength dramatically; common in precast; may reduce long-term strength slightly |
| Air Curing | Least effective; rapid moisture loss can reduce strength 10-30% below potential |
Learn proper technique in our Concrete Curing and Drying Time Guide.
Strength Gain by Temperature
Temperature has a dramatic effect on hydration rate — higher temperatures speed early gain but can reduce ultimate strength.
| Temperature Range | Effect on Curing |
|---|---|
| Below 40°F (4°C) | Hydration nearly stops; strength gain severely retarded, freeze risk |
| 40–50°F | Slow hydration; extended curing time needed to reach target strength |
| 50–70°F | Good, steady strength development; near-optimal long-term strength |
| 70–90°F | Faster early strength gain but risk of rapid moisture loss and slightly lower ultimate strength |
| Above 90°F | Very fast initial set; high risk of plastic shrinkage cracking and reduced long-term strength |
Why Temperature Matters More Than You Think
Research shows identical concrete cured at 35°C reaches about 80% strength at 7 days versus 65% at 20°C — but the 20°C sample often surpasses it in ultimate strength by 90 days, since slower hydration builds a denser microstructure [web:241][web:245].
See our Concrete Temperature Limits Guide for detailed hot and cold weather guidance.
Strength Gain by Weather Conditions
Beyond temperature alone, weather conditions affect moisture retention and curing quality.
| Condition | Effect on Strength Gain |
|---|---|
| Hot Weather | Accelerated setting, higher risk of surface drying and cracking; extra curing care needed |
| Cold Weather | Slowed hydration; may need insulation blankets or heated enclosures |
| Rainy Conditions | Excess surface water can weaken finish layer; cover fresh concrete |
| Dry Climate | Rapid moisture loss; requires diligent curing compound or wet curing |
| Windy Conditions | Accelerates surface evaporation similar to hot/dry weather; windbreaks recommended |
Concrete Strength Gain by Construction Application
Minimum strength recommended before placing the slab into service.
| Project | Recommended Strength Before Use |
|---|---|
| Sidewalks | ~50% (foot traffic, ~5-7 days) |
| Patios | ~65% (light furniture/traffic, ~7 days) |
| Driveways | ~65-70% (vehicle traffic, ~7 days) |
| Garage Floors | ~65-70% (~7 days) |
| Foundations | ~90%+ before heavy structural loading (~14 days) |
| Warehouse Floors | ~90-100% before forklift/rack loading (~14-28 days) |
| Bridge Decks | 100% design strength required before opening to traffic (~28 days) |
When Is Concrete Ready? Chart
Quick field reference for determining readiness before applying different types of loads.
| Use | Minimum Wait Time |
|---|---|
| Walking | 24-48 hours |
| Light Equipment | 3-5 days |
| Passenger Vehicles | 7 days |
| Heavy Trucks | 14-28 days |
| Full Structural Loading | 28 days |
See detailed guidance in our When Can You Walk on Concrete and When Can You Drive on Concrete guides.
Concrete Strength Gain vs Water-Cement Ratio
Water-cement ratio is one of the strongest predictors of long-term concrete strength.
| Ratio | Typical Range | Effect on Long-Term Strength |
|---|---|---|
| Low Ratio | 0.35-0.42 | Highest strength, densest microstructure, lowest permeability |
| Medium Ratio | 0.43-0.50 | Good balance of workability and strength for general use |
| High Ratio | 0.55-0.65+ | Reduced strength, higher porosity, greater long-term shrinkage risk |
Calculate your mix ratio with our Water-Cement Ratio Calculator.
Concrete Strength Gain vs Cement Type
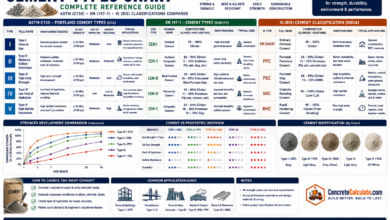
ASTM cement types are engineered with different chemistry that changes the strength development curve.
| Cement Type | Strength Development Characteristic |
|---|---|
| Type I | General purpose; standard strength gain curve |
| Type II | Moderate sulfate resistance; strength gain similar to Type I, slightly slower |
| Type III | High early strength; reaches 7-day equivalent strength in about 3 days |
| Type IV | Low heat of hydration; slower strength gain, used in mass concrete |
| Type V | High sulfate resistance; strength gain similar to Type II, slightly slower initial rate |
⭐ 7-Day vs 28-Day Strength Comparison
This comparison resolves one of the most common questions in concrete quality control.
7-Day Strength
- Typically ~60-65% of 28-day design strength
- Used as an early quality-control check, not final acceptance
- Helps detect major mix problems early
- Not sufficient alone for structural sign-off
28-Day Strength
- Industry-standard benchmark = 100% of design strength
- Standard age for structural engineering acceptance
- Used in specifications, codes, and mix design targets
- Concrete continues gaining strength beyond this point
Common Misconception
Many assume 28-day strength is the concrete’s “maximum” strength — it isn’t. It’s simply the standard testing age chosen for practicality; concrete continues to gain strength for months or years afterward, often reaching 110% or more of the 28-day value by 90 days [web:240][web:246].
Concrete Strength Gain Formula
A general relationship exists between curing time and compressive strength, though actual results depend heavily on mix and conditions.
Several empirical models (like the Abrams’ Law relating strength inversely to water-cement ratio, and the logarithmic strength-age relationship) approximate strength gain, but none replace actual cylinder/cube break testing. Strength at any age = Design Strength × (% from strength gain curve, adjusted for curing conditions and mix specifics).
Important Note
These percentage tables are estimates based on standard conditions. Actual concrete strength always depends on mix design, cement type, curing method, temperature, and must be verified with physical testing per ASTM C39.
Common Strength Gain Mistakes
These errors are the most frequent causes of concrete underperforming its design strength.
Poor curing
Allowing concrete to dry out before hydration completes drastically reduces final strength, sometimes by 30% or more.
Adding excess water
Adding water at the jobsite to improve workability raises the water-cement ratio and significantly lowers ultimate strength.
Premature loading
Driving vehicles or placing heavy loads before adequate strength develops can cause cracking or permanent structural damage.
Cold-weather concreting
Pouring without proper temperature protection can halt hydration or cause freeze damage before strength develops.
Hot-weather drying
Rapid surface drying in hot weather causes plastic shrinkage cracking and can prevent full strength development.
Inadequate moisture retention
Removing curing covers too early or skipping curing compound application interrupts hydration mid-process.
⭐ Visual Concrete Strength Gain Timeline
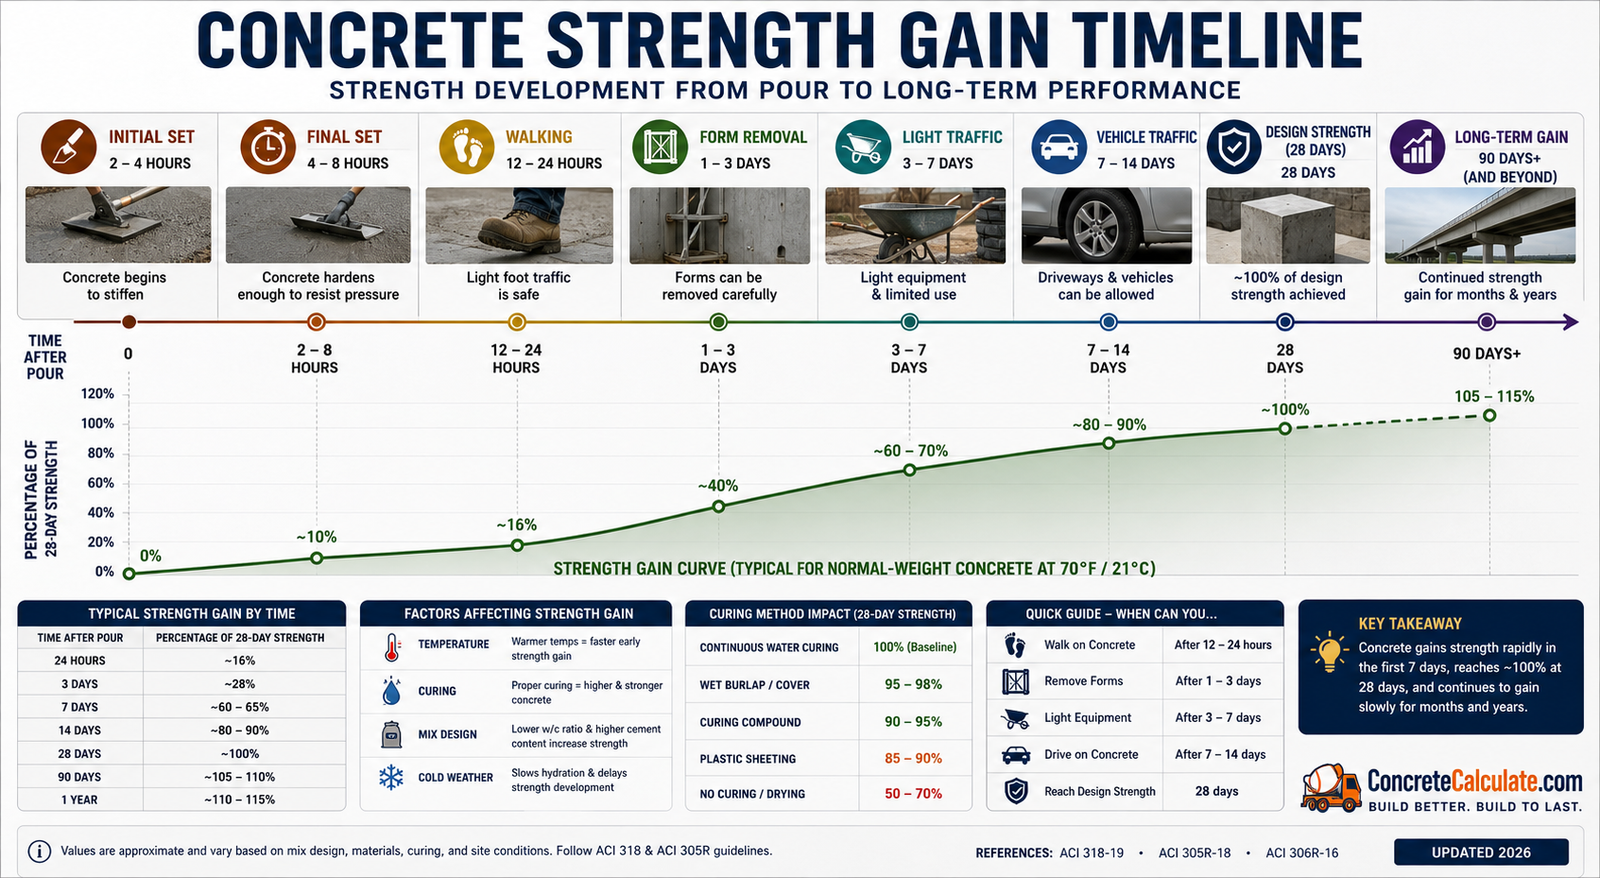
Key milestones in a concrete slab’s life from placement through long-term strength gain.
Initial Set (~2-4 hours)
Concrete begins losing plasticity; surface can no longer be reworked
Final Set (~6-10 hours)
Concrete becomes rigid; finishing operations must be complete
Walking (~24-48 hours)
Surface can typically support foot traffic without damage
Form Removal (~24-72 hours)
Vertical forms can usually be stripped once concrete reaches ~40% strength
Light Traffic (~3-5 days)
Light equipment and foot traffic generally safe
Vehicle Traffic (~7 days)
Passenger vehicles can typically drive on the slab at ~65% strength
Design Strength (~28 days)
Concrete reaches its specified design/testing strength benchmark
Continued Long-Term Gain (56-90+ days)
Strength continues climbing slowly, often reaching 105-110%+ of the 28-day value
Contractor Worked Examples
Real-world strength gain timing decisions for common job scenarios.
Residential Driveway
Garage Slab
House Foundation
Warehouse Floor
Industrial Slab
Frequently Asked Questions
📥 Download Concrete Strength Gain Chart PDF
Use your browser’s print function to instantly save this page as a PDF — a printable engineering reference with strength gain tables, timeline charts, temperature recommendations, curing method comparisons, and a project readiness guide.