
Concrete Maturity Method: ASTM C1074 & Formulas
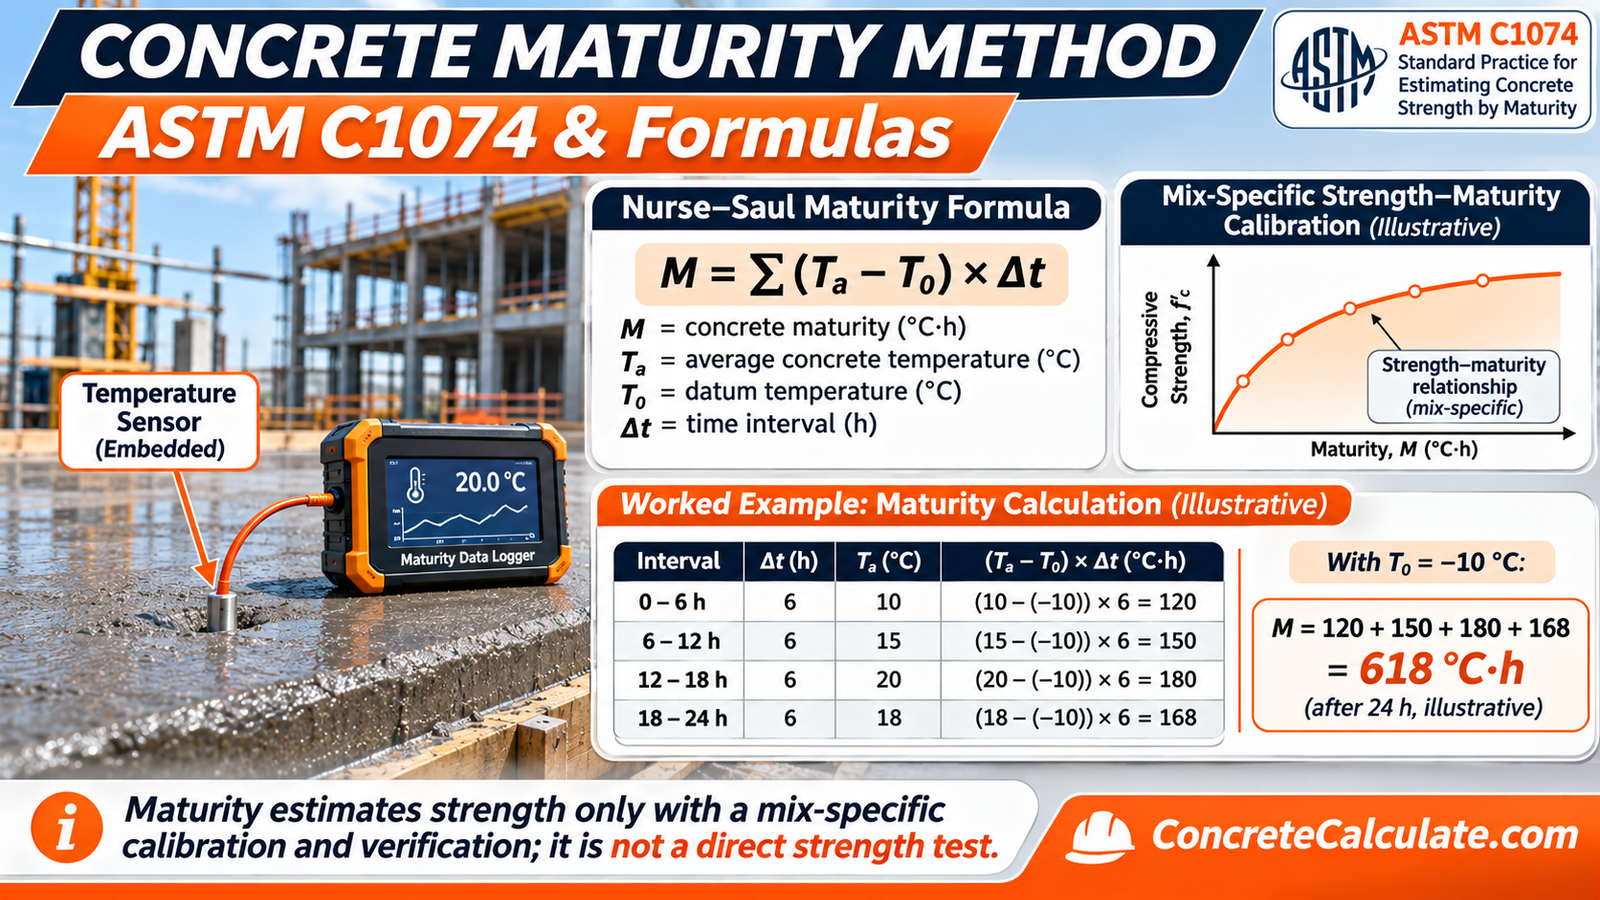
The concrete maturity method estimates in-place strength from the concrete’s recorded temperature history. You calibrate the mix first to link a maturity index to measured strength, embed sensors, calculate maturity, read the estimated strength from the curve, and verify it. Maturity is an estimate, not a measurement.
What Is the Concrete Maturity Method and How Does It Work?
The concrete maturity method estimates in-place concrete strength from the temperature history of the concrete itself. A mixture-specific calibration links a maturity index to measured strength, so recorded field temperatures can be converted into an estimated strength.
It is an estimate, not a direct strength measurement. The five steps in Table 1 show how the process runs from calibration to a verified result.
| Step | Activity | Required information | Output | Important caution |
|---|---|---|---|---|
| 1 | Establish mixture-specific calibration | Actual mix, specimens, strength tests, maturity function | Strength-maturity relationship | Must come before field readings are read as strength |
| 2 | Install and identify sensors | Monitoring plan, locations, pour identification | Labeled monitoring locations | Sensors must represent the decision location |
| 3 | Record concrete temperature history | Continuous temperature and time stamps | Temperature-time dataset | Use in-place concrete temperature, not weather data |
| 4 | Calculate maturity | Datum or activation energy, logged temperatures | Temperature-time factor or equivalent age | Use the same function and parameters as the calibration |
| 5 | Estimate and verify strength | Calibration curve, supplementary tests | Estimated in-place strength | Verification and project criteria still apply |
Table 1. The five-step concrete maturity workflow. Calibration comes first.
Think of maturity as an accounting method. Warm concrete banks hydration progress faster than cold concrete, and the calibrated curve tells you what a given balance means for that mix.
Why Concrete Maturity Matters in Construction
Concrete gains strength as cement hydrates and other cementitious reactions proceed, and the pace of those reactions depends on temperature. Maturity tracks that combined effect of time and temperature instead of counting calendar days.
Fixed-age assumptions, such as “strip at 3 days,” can be wrong when the actual slab is colder or warmer than the specimens that set the rule. The Concrete Curing and Drying Time Guide covers general timelines, while maturity addresses the in-place condition.
Practical benefits can include better-informed scheduling, monitoring through changing weather, and fewer unnecessary delays. Maturity does not guarantee a shorter schedule or lower testing cost on every project.
The Relationship Between Concrete Temperature, Time, and Strength
Strength development depends on both how long concrete has cured and how warm it has been. Higher temperatures speed early hydration, and lower temperatures slow it.
Two portions of the same mixture can follow different temperature histories and still reach the same maturity index. NRMCA’s CIP 39 gives an example in which concrete held at 50°F for 7 days could match concrete held at 80°F for 3 days.
That equivalence assumes adequate moisture for hydration and a mixture that matches the calibrated one. See the Concrete Curing Temperature Chart for temperature reference data.
The Nurse-Saul method accumulates time and temperature above a selected datum, allowing different temperature histories to produce the same maturity index.
The diagram uses constant illustrative temperatures. Real concrete temperature changes continuously, so loggers record it and the maturity is summed in small intervals.
ASTM C1074: Standard Practice for Estimating Concrete Strength
ASTM C1074 is the primary U.S. practice for the maturity method. It expresses the maturity index either as a temperature-time factor or as an equivalent age at a specified temperature, and it requires a laboratory strength-maturity relationship plus the temperature history of the concrete being evaluated.
At a high level, the practice calls for these actions:
- Select an appropriate maturity function
- Establish a mixture-specific strength-maturity relationship
- Record the temperature history of the in-place concrete
- Determine the maturity index
- Estimate strength from the calibration
- Supplement the estimate with other indications of strength
ASTM states that the practice can support removal of formwork and reshoring, post-tensioning, termination of cold-weather protection, and opening roadways.
Its stated limits are that concrete must stay in a condition that permits hydration, early-age temperature effects on long-term strength are not captured, and other indications of strength are needed.
ASTM lists C1074-19e1 as the active edition at the time of writing. Confirm which edition your contract requires, and read the full standard for procedures, since public pages show only the scope and significance.
Understanding Concrete Maturity Index and Its Units
The maturity index is a number that summarizes the time-temperature history of the concrete. ASTM C1074 allows two forms.
- Temperature-time factor (TTF): usually in °C·h or °C·days, from the Nurse-Saul function
- Equivalent age: in hours or days at a defined reference temperature, from the Arrhenius function
These are not interchangeable. A TTF of 600 °C·h and an equivalent age of 600 hours describe different things and map to strength through different calibrations.
A maturity index is never a strength. A value such as 618 °C·h cannot be turned into PSI with a universal factor.
ASTM C1074 specifies SI units for the maturity index, so °C·h is the working unit in this guide, and the Concrete Strength Gain Chart covers general age-based trends instead.
The Two Main Concrete Maturity Methods
ASTM C1074 provides two maturity functions. Table 2 compares them side by side.
Nurse-Saul temperature-time factor
The Nurse-Saul function adds up the temperature above a datum multiplied by time. It assumes the early rate of strength gain is a linear function of temperature, and the FHWA TechBrief notes it is the most widely used approach among state agencies because of its simplicity.
Arrhenius equivalent age
The Arrhenius function converts real curing time into an equivalent time at a reference temperature, using an activation energy. It assumes an exponential temperature effect and better represents nonlinear behavior across wide temperature swings.
Choose between them based on project requirements, mixture behavior, the temperature range expected, and how the calibration will be developed.
| Feature | Nurse-Saul | Arrhenius equivalent age | Practical consideration |
|---|---|---|---|
| General model | Linear temperature dependence | Exponential temperature dependence | Arrhenius suits wider temperature ranges |
| Output | Temperature-time factor | Equivalent age | Not interchangeable numbers |
| Typical units | °C·h or °C·days | Hours or days at a reference temperature | State the reference temperature |
| Key parameter | Datum temperature | Activation energy | Both are mixture-specific |
| Temperature basis | Difference from datum | Absolute temperature relative to a reference | Arrhenius needs kelvin |
| Main requirement | Suitable calibrated relationship | Suitable activation parameter and calibration | Use the same function in calibration and field |
Table 2. Nurse-Saul compared with Arrhenius. Neither method guarantees accuracy unless its parameters and calibration suit the mixture.
Nurse-Saul Maturity Method: Formula and Explanation
The Nurse-Saul function sums the product of temperature above the datum and the time spent at that temperature, interval by interval.
Formula: Nurse-Saul Temperature-Time Factor
Variables: M(t) is the accumulated temperature-time factor in °C·h, Ta,i is the average concrete temperature in °C during interval i, T0 is the datum temperature in °C, and Δti is the interval length in hours.
Rule: periods at or below the datum add no positive maturity. Real instruments follow the algorithm in the selected standard, so check how your logger handles that case.
Units: keep temperature and time units consistent throughout.
What Is Datum Temperature in Concrete Maturity Calculations?
The datum temperature is the temperature at which strength gain is assumed to stop in the Nurse-Saul model. It is a parameter of the function, not a physical constant.
Sources differ on typical values. FHWA states that −10°C (14°F) is generally used, while NRMCA suggests 0°C for Type I portland cement across an expected range of 0 to 40°C, and WisDOT defaults to 32°F (0°C) unless a mix-specific value is used.
Changing the datum changes the calculated maturity. Using the four-interval example from the next section, a datum of −10°C gives 618 °C·h, but a datum of 0°C gives 378 °C·h for the same temperatures.
Do Not Tune the Datum to Raise the Estimate
Selecting a more favorable datum to inflate maturity is not acceptable. The datum must be appropriate to the mixture, consistent with the calibration, and approved under the project specification.
ASTM C1074 includes an appendix procedure for determining a mixture-specific datum when maximum accuracy is wanted.
How to Calculate Concrete Maturity Step by Step
The example below uses assumed average in-place concrete temperatures and a datum of −10°C, chosen for illustration and consistent with this example only.
Calculation: Four 6-Hour Intervals
Increments: 120 + 150 + 180 + 168 °C·h.
Result: M = 618 °C·h after 24 hours.
Interpretation: 618 °C·h is a maturity index. It cannot establish strength without a calibration for the mix.
| Interval | Duration (h) | Average concrete temperature (°C) | Datum (°C) | Incremental maturity (°C·h) | Cumulative maturity (°C·h) |
|---|---|---|---|---|---|
| 0 to 6 h | 6 | 10 | −10 | 120 | 120 |
| 6 to 12 h | 6 | 15 | −10 | 150 | 270 |
| 12 to 18 h | 6 | 20 | −10 | 180 | 450 |
| 18 to 24 h | 6 | 18 | −10 | 168 | 618 |
| Total | 24 | n/a | n/a | 618 | 618 |
Table 3. Worked Nurse-Saul calculation. All temperatures are assumed average in-place concrete temperatures, and the datum is illustrative.
How to Calculate Maturity From Hourly Temperature Sensor Data
Real loggers record temperature at fixed intervals, and the maturity calculation follows the same pattern as the table above. The steps are repeated for every logged interval.
- Read the time stamp and sampling interval
- Average the temperature across each interval
- Subtract the datum from that average
- Multiply by the interval length to get the increment
- Add the increment to the running total
Example: Averaging Successive Readings
Given: hypothetical hourly readings of 12, 14, 17, and 19°C at hours 0, 1, 2, and 3, with a datum of −10°C.
Interval averages: 13, 15.5, and 18°C.
Increments: (13 + 10) × 1 = 23, (15.5 + 10) × 1 = 25.5, and (18 + 10) × 1 = 28 °C·h.
Result: 76.5 °C·h over the first three hours.
Average the readings that bracket each interval when your logger does not do it for you. Never substitute a single daily ambient temperature for the logged in-place concrete temperature, because hydration heat and protection make the two differ.
Arrhenius Equivalent Age Method: Formula and Interpretation
The Arrhenius function converts the real curing time into the equivalent time at a reference temperature. Warmer-than-reference periods add more equivalent hours, and cooler periods add fewer.
Formula: Equivalent Age
Variables: te is equivalent age, Ea is apparent activation energy in J/mol, R is 8.314 J/(mol·K), Ta,i is the concrete temperature in kelvin, Tr is the reference temperature in kelvin, and Δti is the interval.
Critical rule: convert °C to kelvin (add 273.15, or 273 as FHWA does) in the reciprocal terms. Do not insert Celsius values directly.
Illustrative Example: Same Four Intervals
Assumptions: Ea = 42,000 J/mol (a value NRMCA suggests for Type I cement, used here for illustration only) and a 20°C reference temperature.
Rate factors: 10°C gives 0.544, 15°C gives 0.742, 20°C gives 1.000, and 18°C gives 0.888.
Equivalent age: 6 × (0.544 + 0.742 + 1.000 + 0.888) = 19.0 h at 20°C.
What it means: the 24 hours of cooler-than-reference curing counts as about 19 hours at 20°C.
Compared with the reference condition, warmer curing raises equivalent age faster and cooler curing slows it. Activation energy is also a mixture-specific parameter.
Nurse-Saul vs Arrhenius: Which Method Should Be Used?
The choice depends on the project specification first, then on the factors below. Neither function is universally superior.
- Temperature range: wide swings favor Arrhenius, narrower ranges often suit Nurse-Saul.
- Mixture behavior: strongly nonlinear temperature response favors Arrhenius.
- Parameter availability: you need a defensible datum or activation energy.
- Instrument support: the logger must run the chosen function.
- Calibration method: the same function must be used in calibration and in the field.
- Expected accuracy: accuracy depends on parameters and validation, not on the function name.
NRMCA notes that the Nurse-Saul function loses accuracy for concrete whose early strength gain is highly nonlinear with temperature, though it is considered adequate for most applications. Arrhenius may represent nonlinearity better, but it is not automatically more accurate without appropriate parameters and verification.
What Is a Concrete Strength-Maturity Relationship?
A strength-maturity relationship is an experimentally determined link between maturity index and measured strength for one mixture. It is what turns a field maturity number into an estimated strength.
Typically strength rises steeply at low maturity and then flattens as maturity accumulates, so each added unit of maturity buys less strength. The curve belongs to a specific mixture and the test conditions used to build it.
For general age-based trends, see the Concrete Strength Gain Chart, which is not a maturity calibration.
A strength-maturity relationship converts the measured maturity of a particular concrete mixture into an estimated in-place strength.
The diagram plots the hypothetical dataset used later in this guide. It is a teaching illustration and must not be read as a chart for any real concrete.
How to Develop a Concrete Maturity Calibration Curve
Calibration is done with the actual mixture before field readings are interpreted. The workflow follows ASTM C1074 at a general level.
- Identify the concrete mixture that will be used on the project, including materials and proportions.
- Prepare test specimens from that mixture.
- Monitor specimen temperatures with embedded sensors.
- Test specimens at selected ages or maturity levels.
- Associate each measured strength with the maturity at test time.
- Establish the fitted relationship appropriate to the data.
- Document the mixture, parameters, and the range the data cover.
Specimen counts, test ages, curing procedures, and approval rules must follow the applicable standard and project specification. As one agency example, WisDOT requires at least 15 cylinders, sensors in at least two of them, and tests at 1, 3, 7, 14, and 28 days.
FHWA likewise notes that project-specific materials must be used, and that changes in material sources, proportions, or mixing equipment require a new curve.
Concrete Cylinder Testing and Strength Measurements for Calibration
Measured compressive strength is the anchor of the whole relationship. The calibration is only as good as the specimens and tests behind it.
- ASTM C31/C31M: making and curing specimens in the field
- ASTM C192/C192M: making and curing specimens in the laboratory, when applicable
- ASTM C39/C39M: compressive strength testing of cylinders
- ASTM C78: flexural strength by beam testing, where the project controls on flexure
Compressive and flexural calibrations are different relationships. Never combine them in one generic curve. Pavement projects that open on flexural strength need a flexural calibration, or a documented correlation approved by the agency.
Review the Concrete PSI Chart for background on compressive-strength values, and the ACI explanation for the general concept of strength-maturity relationships.
How to Plot and Interpret a Strength-Maturity Curve
Plot measured strength on the vertical axis and maturity on the horizontal axis, then fit a curve through the data. Reading across from a field maturity value to the curve gives the estimated strength.
Table 4 uses a small hypothetical dataset so the arithmetic is easy to follow. These are teaching values, not ASTM reference data.
| Test point | Maturity index (°C·h) | Measured compressive strength (PSI) | Test basis | Interpretation |
|---|---|---|---|---|
| A | 200 | 1,200 | Hypothetical teaching data | Early age, steep gain |
| B | 400 | 2,200 | Hypothetical teaching data | Gain continues |
| C | 600 | 3,000 | Hypothetical teaching data | Used for interpolation |
| D | 800 | 3,600 | Hypothetical teaching data | Used for interpolation |
| E | 1,200 | 4,200 | Hypothetical teaching data | Gain flattens |
Table 4. Hypothetical strength-maturity dataset. In a real project, substitute recorded maturity and matching specimen test results, with the same maturity function used throughout.
The estimate is valid only inside the range the calibration covers. Do not read a strength from a maturity value beyond the highest tested point.
Worked Example: Estimating Concrete Strength From Maturity
This example reuses the 618 °C·h result and the Table 4 data to show the arithmetic of reading a strength. Every input is hypothetical.
Calculation: Linear Interpolation (Demonstration)
Steps: 18 ÷ 200 = 0.09, and 0.09 × 600 = 54.
Result: fc = 3,054 PSI.
Hypothetical Data Only
This arithmetic demonstration does not authorize any loading or formwork removal. A real estimate uses the validated calibration function for the mix, not an automatic interpolation between two convenient points.
What Equipment Is Needed for Concrete Maturity Testing?
At minimum, maturity needs a temperature probe and a clock, as FHWA notes, but modern projects use automated devices.
- Temperature sensors or thermocouples
- Data loggers or maturity meters
- Wireless monitoring systems, where appropriate
- Calibration test specimens and molds
- Software for recording and analysis
- Strength-testing equipment or laboratory services
Consider measurement range, logging frequency, sensor accuracy, durability in fresh concrete, and how data are retrieved. NRMCA advises that the system should support the selected maturity function and allow the constants to be changed.
This guide does not rank or recommend commercial sensor brands.
How to Install Concrete Maturity Sensors Correctly
Installation should follow the project monitoring plan and the manufacturer’s instructions. The goal is a sensor that stays where it was placed and records from the right moment.
- Plan placement before the pour, based on the decision the data will support.
- Position sensors at the locations in the monitoring plan.
- Secure them against movement during placement and consolidation.
- Protect leads and electronics from damage and water ingress.
- Confirm recording starts at the intended time.
- Label each sensor by location and pour.
WisDOT’s guidance adds that sensors should not be switched on until they are embedded in the concrete or the verification cylinders. Sensor location must represent the area controlling the construction decision.

Where Should Concrete Maturity Sensors Be Placed?
Temperature differs between the center and the surface of a concrete element, so placement must match the question being answered. A sensor near an exposed edge reads colder than one at mid-depth.
- Slabs: mid-depth for average strength, nearer the surface where cold exposure controls
- Walls and beams: locations that govern stripping or reshoring, often the coldest or last-placed area
- Pavements: points representing the slab and each placement section
- Footings and large sections: locations reflecting both core and exposed zones
- Exposed edges and cold-weather areas: places where protection is weakest
Geometry, insulation, weather exposure, and placement sequence all affect the choice. As a pavement-specific example from FHWA and ACPA guidance, mid-depth sensors support opening decisions, while sensors within about 1 inch of the surface support joint sawing timing.
Do not treat that as a universal depth or spacing rule. Follow the project monitoring requirements.
How to Monitor Concrete Maturity During Curing
Monitoring runs from placement through the strength estimate, and each check protects the reliability of the result.
- Confirm sensors are working and recording
- Check that the record is continuous with no gaps
- Review temperature trends for abnormal values
- Track cumulative maturity
- Compare the expected strength development with the estimate
- Note weather and protection conditions
- Keep field quality-control records
Continuously updating maturity lets field personnel follow strength gain without breaking a new specimen at every decision point, as NRMCA explains. The estimate still depends on the calibration, so do not skip periodic verification.
Use the Concrete Curing Temperature Chart as general reference, and see the Concrete Curing Temperature Calculator or Concrete Curing Time Calculator for general estimates that are not ASTM-calibrated maturity predictions.
How Cold Weather Affects Concrete Maturity
Lower concrete temperatures slow hydration, so maturity accumulates more slowly. With a datum of −10°C, 24 hours at 5°C adds 15 × 24 = 360 °C·h, only half of the 720 °C·h from 24 hours at 20°C.
Record actual concrete temperature, not forecasts, and keep protection in place as the project requires. The Cold Weather Concrete guide covers placement, protection, and curing in cold conditions.
Maturity Does Not Prove Freeze Protection
A maturity value does not demonstrate that fresh concrete has been protected against freezing or moisture loss. Protection and curing requirements are separate from the calculated index.
How Hot Weather and Early Heat Development Affect Maturity
Higher concrete temperatures accelerate early maturity accumulation, and hydration heat can lift the temperature of large sections well above air temperature. Warm placement and thick elements both speed early readings.
Early strength and later-age strength can diverge. FHWA and ASTM both warn that the method does not account for the effect of high early-age temperature on long-term strength, so quick early maturity does not prove a better outcome later.
Never raise curing temperature simply to push maturity readings upward. For placement practices in warm conditions, see the guide on pouring concrete in hot weather.
How Mix Design Changes Affect Maturity Calibration
A calibration describes one mixture. When materials or proportions change, the relationship can change too, and the datum or activation energy may no longer fit.
- Cement type and source
- Supplementary cementitious materials
- Water-cementitious materials ratio
- Admixtures
- Aggregate and mixture changes
- Batching and production adjustments
NRMCA lists changes in cementitious materials, admixtures, batching accuracy, and air content as causes of erroneous estimates. Significant changes require re-evaluating the strength-maturity relationship, datum, and activation energy.
Two mixtures with the same specified 28-day strength should not be assumed to share an early-age relationship. The Concrete PSI Guide explains why a PSI number alone does not describe a mix.
How to Verify and Validate Maturity-Based Strength Estimates
Independent verification confirms that the calibration still matches the concrete being placed. ASTM C1074 recommends supplementary tests before safety-critical operations, and NRMCA stresses periodic checks.
- Cast verification specimens from the production concrete
- Test them at appropriate maturity levels
- Compare the results with the calibration prediction
- Check periodically for mixture changes
- Review abnormal temperature readings
- Document the acceptance criteria
NRMCA lists options such as ASTM C803 penetration resistance, C873 cast-in-place cylinders, C900 pullout tests, and field-molded cylinders fitted with maturity instruments.
Wisconsin DOT offers one agency example in section 870.4.8 of its Construction and Materials Manual.
It requires a separate calibration curve for each mix, a new curve when verification cylinder strength differs from the curve by more than 10 percent or the mix changes, and a set of three verification cylinders each workweek.
Agency Rules Are Not Universal
The 10 percent criterion and weekly frequency are WisDOT contract requirements. They are not ASTM C1074 requirements, so use the criteria in your own specification.
Concrete Maturity Method vs Traditional Cylinder Testing
The two methods measure different things, and each has a role. Cylinders measure specimen strength, while maturity estimates the in-place strength of a calibrated mixture from its actual temperature history.
Field-cured cylinders may not copy the structure’s temperature history because of size differences, which is why NRMCA calls maturity a more reliable indicator of in-place strength. NRMCA also states that maturity is not intended to replace standard-cured cylinders for quality assurance.
| Feature | Maturity method | Cylinder testing | Practical implication |
|---|---|---|---|
| Main result | Estimated in-place strength | Measured specimen strength | Different information, so they complement each other |
| Measurement | Concrete temperature history | Physical failure load | Maturity needs a calibration to give strength |
| Mixture calibration | Required | Not the same calibration process | Mix changes affect maturity directly |
| Monitoring | Potentially continuous | At selected test ages | Maturity can track decisions between breaks |
| Local field conditions | Sensor locations capture selected temperature histories | Depends on how specimens are cured | Specimens may not match the structure |
| Strength validation | Required by applicable procedures | Direct specimen strength data | Verification links the two |
| Acceptance use | Depends on specifications | Follows prescribed acceptance criteria | Do not assume one replaces the other |
Table 5. Maturity compared with cylinder testing. Neither is inherently inaccurate or unnecessary.
Fresh-concrete tests are separate again. For example, the Concrete Slump Test Procedure checks consistency at placement, not strength development.
Using Concrete Maturity for Formwork Removal and Reshoring
Maturity estimates can support decisions about form removal, reshoring, and subsequent construction loads, which ASTM lists among its intended uses.
The required strength comes from the engineer and the project documents, not from the maturity system. A maturity reading alone is not permission to strip forms.
Hypothetical Decision Scenario
Situation: the engineer specifies a required strength before stripping a slab soffit.
Process: the calibrated maturity record shows an estimated strength above that requirement at the controlling sensor location.
Next step: the team completes the specified supplementary check and obtains the engineer’s authorization before stripping.
No universal removal percentage is given here. Required strength depends on the structure, loads, and design.
Using Concrete Maturity for Pavements and Opening to Traffic
Transportation agencies use maturity to decide when pavement can open because strength gain depends on local temperature, not the calendar. FHWA identifies opening time as one of the method’s greatest benefits, especially on fast-track projects.
- A specified opening strength in the contract
- Whether compressive or flexural strength controls
- A calibration for the correct strength property
- Field temperature monitoring
- Verification testing
- Agency authorization
FHWA notes that minimum opening strengths vary with slab design, support conditions, and expected traffic, with 300 psi flexural strength typical in third-point loading as an example. Agencies such as MnDOT publish their own maturity specifications and procedures.
See the FHWA maturity TechBrief for pavement applications, and the When Can You Drive on Concrete? guide for general timing advice that does not rely on maturity monitoring.
Other Construction Applications of Concrete Maturity Testing
Beyond forms and pavements, maturity estimates can inform several other decisions when the specification permits.
- Post-tensioning: timing of stressing operations
- Ending cold-weather protection: removal of insulation or heat
- Backfilling structural walls: timing of lateral loading
- Precast handling: scheduling stripping or handling where allowed
- Construction loads: coordinating later-stage loads
Applicability and release criteria are set by project specifications and responsible engineering personnel. Maturity supplies an estimate that feeds those decisions.
Limitations and Common Errors in the Concrete Maturity Method
Most failures come from using the method outside the conditions it assumes. Table 6 lists the most consequential errors.
- Concrete must stay in a condition that permits hydration, so moisture loss undermines results.
- Consolidation and placement problems may not show up in temperature records.
- Early high-temperature curing can raise early strength while reducing long-term strength.
- Maturity does not establish durability or other later-age properties.
| Error | Why it matters | Corrective action | When to escalate |
|---|---|---|---|
| Wrong maturity calibration | Estimated strength can be badly off | Verify mixture identity and recalibrate as required | Whenever verification disagrees with the curve |
| Incorrect datum temperature | Maturity values shift | Review the approved function and parameters | Before any critical operation |
| Missing temperature records | Gaps break the running total | Investigate sensor failure and data validity | If gaps cover a decision window |
| Sensor at nonrepresentative location | Estimate may not match the controlling area | Review the monitoring plan | Before authorizing the operation |
| Mixture changes | Calibration may no longer apply | Validate or replace the relationship | Any change in materials or proportions |
| Poor curing or moisture loss | Hydration may stall | Inspect actual curing and concrete quality | When surfaces dry out or cure is interrupted |
| Extrapolating beyond calibration | Curve may not hold outside tested data | Obtain more data and approval | Before using values past the highest point |
| Treating maturity as measured strength | Index is not strength | Apply the validated strength relationship | If anyone quotes PSI from °C·h alone |
| Confusing °C·h with °F·h | Numbers differ by a factor of 1.8 | Keep the standard unit, °C·h | When logged data use mixed units |
| Using readings alone for critical work | Hidden defects are not detected | Follow required verification and authorization | Before post-tensioning or stripping |
Table 6. Maturity testing errors, corrective actions, and escalation triggers.
For scale, 618 °C·h equals 1,112 °F·h, so mixing the two units produces large errors.
How Much Does Concrete Maturity Testing Cost, and When Is It Worth Using?
Costs depend on the project, so this guide gives no sensor prices or savings percentages. The cost structure has several parts.
- Calibration specimen preparation and testing
- Sensors and logging equipment
- Software or monitoring services
- Installation and field labor
- Verification testing
- Data review and documentation
FHWA notes that the main drawback is the significant up-front effort and cost of establishing the curve for each mix, while maturity monitoring can reduce quality assurance testing.
Value tends to be greatest on projects with several pours of the same mix, tight schedules, cold-weather conditions, or strength-dependent operations.
Do not assume maturity will always shorten a schedule or lower testing cost. Compare the added calibration and monitoring effort with the delay risk of the decisions it supports.
Concrete Maturity Method FAQs and Final Checklist
What is the concrete maturity method?
The concrete maturity method estimates in-place concrete strength from the temperature history of the concrete. A mixture-specific calibration links a maturity index to measured strength, and sensor data are converted to an estimate. It is an estimate rather than a direct measurement, so verification and project criteria still apply.
What does ASTM C1074 cover?
ASTM C1074 covers estimating concrete strength by the maturity method. It expresses maturity as a temperature-time factor or an equivalent age, requires a laboratory strength-maturity relationship, and requires the temperature history of the concrete being evaluated. It also notes that other indications of strength should supplement the estimate.
What is the Nurse-Saul maturity formula?
The Nurse-Saul formula is M = Σ (Ta − T0) × Δt, where Ta is the average concrete temperature in an interval, T0 is the datum temperature, and Δt is the interval length. The result is a temperature-time factor in °C·h, which only becomes strength through a calibration.
What is the difference between maturity and concrete curing time?
Curing time is elapsed time under curing conditions. Maturity combines elapsed time with the actual concrete temperature over that time. Two pours of the same age can have very different maturity if one was warm and the other cold, so maturity tracks hydration progress more closely.
Can maturity be converted directly into PSI?
No. A maturity index has no universal PSI conversion. Strength is read from a strength-maturity relationship developed for the specific mixture. A value of 618 °C·h can mean different strengths in different mixes, and values outside the calibrated range should not be used.
Is −10°C always the correct datum temperature?
No. FHWA says −10°C is generally used, but NRMCA suggests 0°C for Type I cement across a 0 to 40°C range, and WisDOT defaults to 0°C unless a mix-specific value applies. The datum must suit the mixture and match the calibration.
Can wireless sensors measure concrete strength?
No. Wireless maturity sensors record concrete temperature over time. Software converts that record into a maturity index and then into an estimated strength using a validated calibration for the mix. The sensor measures temperature, and strength is an estimate that still needs verification.
Does maturity testing replace concrete cylinders?
Not entirely. Cylinders are still needed to build the calibration and to verify it, and project acceptance testing follows the specification. NRMCA states maturity is not intended to replace standard-cured cylinders for quality assurance, though it can reduce reliance on field-cured cylinders.
Can maturity testing determine when forms can be removed?
It can support the decision, since ASTM lists formwork removal as an intended use. The required strength comes from the engineer and project documents, and supplementary checks may be required before critical operations. A maturity reading alone is not authorization.
How accurate is the concrete maturity method?
No single accuracy figure applies. Accuracy depends on the calibration, an appropriate datum or activation energy, representative sensor locations, adequate moisture, and a mix that matches the calibrated one. Agencies check it with verification testing, such as WisDOT requiring a new curve when verification cylinders differ by more than 10 percent.
Final Maturity Checklist
- Confirm the concrete mixture matches the calibrated mixture.
- Use the maturity function and parameters approved for the project.
- Confirm a valid calibration covers the maturity range you are reading.
- Check that sensors are in representative, documented locations.
- Check that temperature records are intact and in consistent units.
- Confirm moisture and curing conditions allowed hydration.
- Complete required verification and supplementary testing.
- Apply approved decision criteria and obtain authorization before critical operations.
The concrete maturity method works best when calibration, sensors, verification, and approved criteria all line up. Before relying on any estimate, confirm the calibration for your mix and review the temperature chart for the conditions you expect.
Check Temperature Effects on Curing
Use the curing temperature reference to see how cold and hot conditions influence hydration before you plan a maturity monitoring program.
Open the Concrete Curing Temperature Chart