Concrete Curing Time Chart 2026: Complete Timeline & Strength Guide
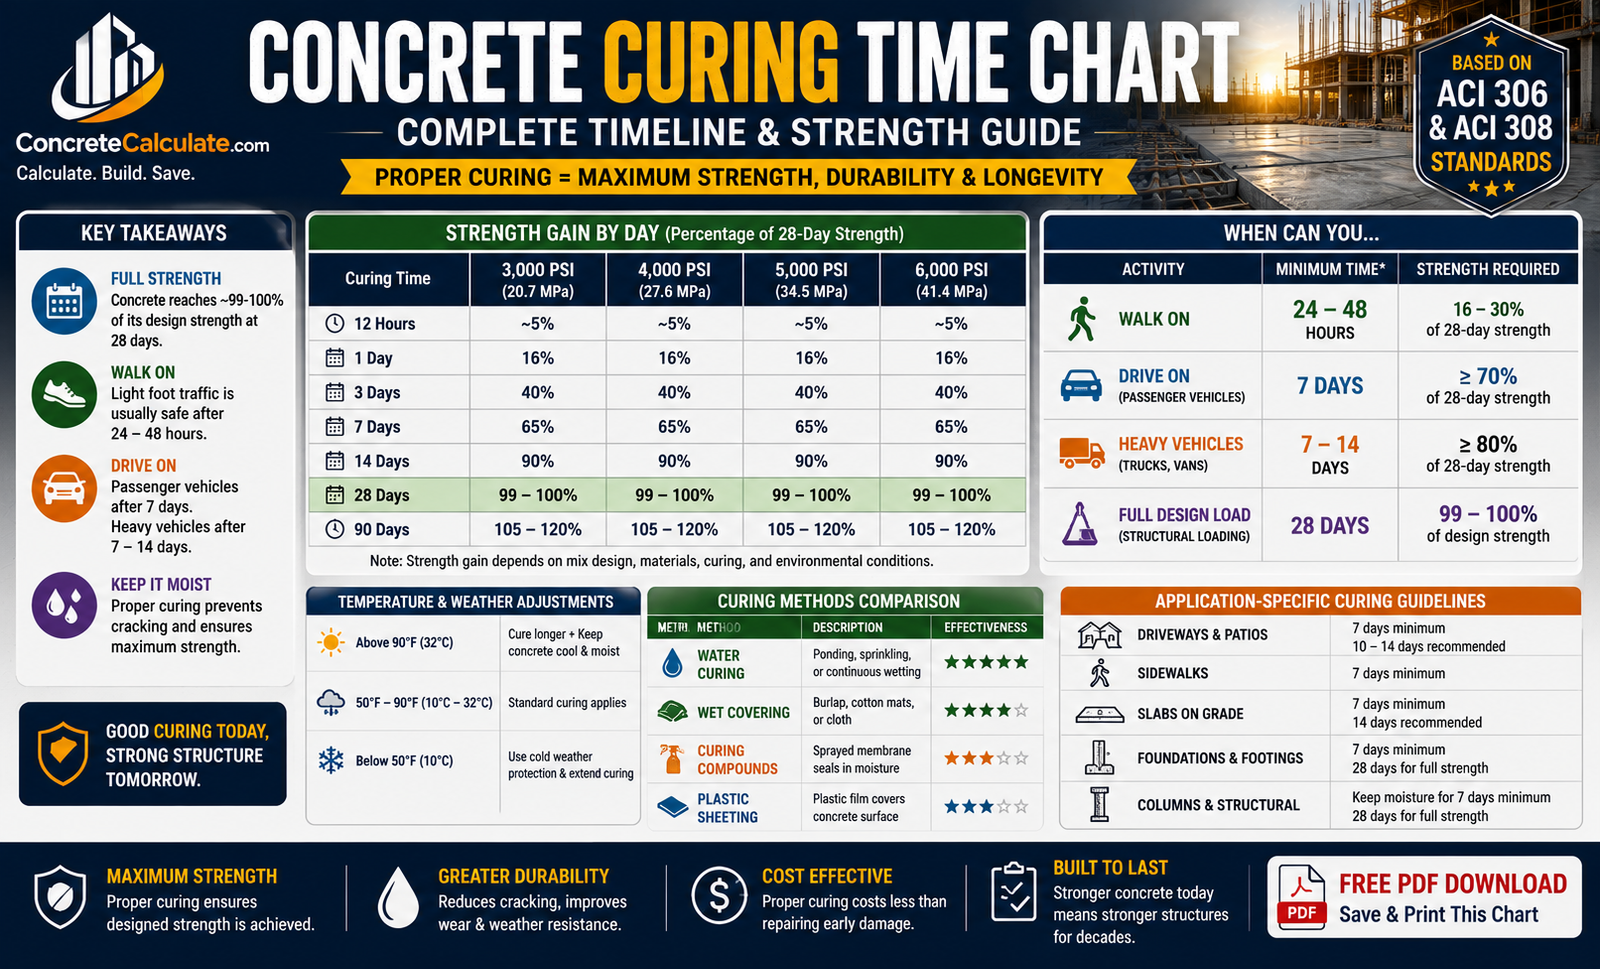
Concrete Curing Time Chart
Complete Timeline & Strength Guide
The complete curing reference for contractors, engineers, and DIYers — strength gain by day, walk/drive timing, temperature adjustments, and curing methods compared.
 Reviewed by Muhammad Ramzan Babar, PhD Researcher (Plasma Physics) & Calculator Developer — View Profile
⭐ Concrete Curing Time Chart
Complete curing timeline from placement to full 28-day design strength.
How to Read This Chart
Curing is the moisture-and-temperature-controlled process that lets cement hydrate and gain strength — separate from surface drying. Learn more in our full Concrete Curing & Drying Time Guide.
| Milestone | Typical Timing | What Happens |
|---|---|---|
| Initial Set | 2–4 hours | Concrete stiffens, no longer flows |
| Final Set | 4–8 hours | Surface hard enough to begin finishing |
| Light Foot Traffic | 24–48 hours | ~16–30% strength; can walk carefully |
| Form Removal (vertical) | 24–48 hours | Sidewalls stripped, surface still curing |
| Vehicle Traffic | 7 days | ~65–70% strength; light vehicles OK |
| Full Design Strength | 28 days | 99–100% design strength (f’c) reached |
| Continued Hardening | 56–90+ days | 105–120% strength; slow ongoing gain |
Concrete Strength Gain Chart
Approximate percentage of 28-day design strength achieved at each curing milestone.
| Age | Approximate Strength (%) |
|---|---|
| 1 Day | 16% |
| 3 Days | 40% |
| 7 Days | 65% |
| 14 Days | 90% |
| 28 Days | 99–100% |
| 56 Days | 105–110% |
| 90 Days | 110–120% |
Percentages based on Type I/II Portland cement under standard moist curing at 70°F. Source: ACI 308 curing guidance.
When Can You Walk on Concrete?
Quick reference for foot traffic timing by project type. Full guide: When Can You Walk on Concrete.
| Application | Safe to Walk |
|---|---|
| Sidewalks | 24–48 hours |
| Patios | 24–48 hours |
| Residential Slabs | 24–48 hours |
| Commercial Slabs | 48–72 hours |
When Can You Drive on Concrete?
Vehicle weight significantly changes the safe waiting period. Full guide: When Can You Drive on Concrete.
| Vehicle Type | Minimum Wait |
|---|---|
| Passenger Cars | 7 days |
| SUVs | 7 days |
| Pickup Trucks | 7–10 days |
| Delivery Vans | 10 days |
| Heavy Trucks | 28 days (full strength) |
A common rule of thumb is to wait 7 days before any vehicle traffic on a new driveway, regardless of vehicle weight.
⭐ Concrete Drying Time vs Curing Time Chart
These terms are often confused — drying is surface moisture evaporation, while curing is the hydration process that builds strength.
| Stage | Timing | Description |
|---|---|---|
| Initial Set | 2–4 hours | Concrete becomes rigid, cannot be reworked |
| Final Set | 4–8 hours | Surface hardens enough for finishing operations |
| Drying (surface) | Days to weeks | Visible moisture evaporates; affects appearance, not strength directly |
| Curing | Minimum 7 days | Active moisture retention allows cement hydration and strength gain |
| Full Strength | 28 days | Design compressive strength (f’c) achieved |
Key Distinction
Concrete can look dry within days but still be far from cured. Cutting curing short — even if the surface looks dry — is one of the most common causes of weak, cracked slabs.
Concrete Curing Time by Temperature Chart
Ambient temperature directly affects hydration speed and required curing duration, per ACI 306 cold weather guidance.
| Temperature | Recommended Curing Time |
|---|---|
| Below 40°F (4°C) | 14+ days with cold-weather protection (ACI 306) |
| 40–50°F | 10–14 days |
| 50–70°F | 7–10 days (standard) |
| 70–90°F | 7 days with added moisture control |
| Above 90°F | 7 days minimum, frequent moisture reapplication required |
Per ACI 306, setting time increases roughly one-third for every 10°F drop in temperature. Source: ACI 306R Guide to Cold Weather Concreting.
Concrete Curing Time by Weather Conditions
Beyond temperature alone, weather conditions like humidity and wind significantly affect curing outcomes.
| Condition | Impact on Curing | Recommended Adjustment |
|---|---|---|
| Hot Weather | Rapid moisture loss, faster set | Continuous water curing, shade, evaporation retardants |
| Cold Weather | Slowed hydration, freeze risk | Insulating blankets, heated enclosures, extended cure time |
| Rainy Conditions | Surface damage if before final set | Cover with plastic sheeting until final set achieved |
| Dry Climate | Accelerated surface drying, shrinkage cracking risk | Curing compound or wet burlap, extra monitoring |
| High Humidity | Slower drying, generally favorable for curing | Standard curing methods work well |
| Windy Conditions | Accelerated surface evaporation | Windbreaks, curing compound applied immediately after finishing |
Curing Time by Construction Application
Minimum vs recommended cure times for common residential and commercial projects.
| Project | Minimum Cure | Recommended Cure |
|---|---|---|
| Driveways | 7 days | 28 days for full strength |
| Patios | 3 days (light use) | 7 days |
| Sidewalks | 3 days | 7 days |
| Foundations | 7 days | 28 days before full loading |
| Garage Floors | 7 days | 28 days for vehicle-heavy use |
| Basement Slabs | 3–5 days | 7 days |
| Pool Decks | 7 days | 28 days before pool filling |
| Retaining Walls | 7 days | 28 days before backfilling |
Concrete PSI vs Curing Time Chart
How curing duration affects compressive strength for a typical 4,000 PSI design mix.
| Curing Age | % of Design Strength | Example: 4,000 PSI Mix |
|---|---|---|
| 1 Day | 16% | ~640 PSI |
| 3 Days | 40% | ~1,600 PSI |
| 7 Days | 65% | ~2,600 PSI |
| 14 Days | 90% | ~3,600 PSI |
| 28 Days | 99–100% | ~4,000 PSI |
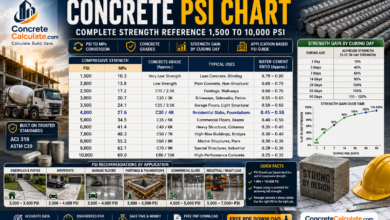
For full PSI ranges and grade equivalents, see our Concrete PSI Chart.
Concrete Mix Type vs Curing Time
Different mix formulations cure at different rates depending on cement chemistry and additives.
| Mix Type | Typical Cure to Full Strength | Notes |
|---|---|---|
| Standard Concrete | 28 days | Type I/II Portland cement, standard hydration curve |
| High-Strength Concrete | 28–56 days | Lower w/c ratio slows early hydration but yields higher final strength |
| Rapid-Setting Concrete | 1–4 hours to walk, 24 hours to load | Special cements for fast-track repairs |
| Fiber-Reinforced Concrete | 28 days | Similar curing to standard mix; fibers reduce cracking during cure |
| Air-Entrained Concrete | 28 days | Slightly reduced strength gain rate due to air voids; needs full 7-day moist cure |
Curing Methods Comparison Chart
Choosing the right curing method depends on climate, project size, and budget.
| Method | Advantages | Best Use |
|---|---|---|
| Water Curing | Most effective; continuously replenishes moisture | Hot weather, high-value slabs |
| Wet Burlap | Retains moisture, low cost, easy to apply | Sidewalks, driveways, small residential jobs |
| Plastic Sheeting | Traps moisture, no reapplication needed | Slabs, foundations, cost-effective coverage |
| Curing Compounds | Fast application, no removal needed, forms sealing membrane | Large commercial slabs, tight schedules |
| Steam Curing | Accelerates strength gain dramatically | Precast concrete, plant production |
| Ponding | Excellent moisture retention | Flat horizontal slabs, pavements |
Studies comparing curing methods consistently find wet burlap and water curing produce the highest compressive strength, while curing compounds better reduce plastic shrinkage cracking.
Concrete Moisture Loss Timeline
Moisture content drives hydration — losing it too early stalls strength development permanently.
| Time After Placement | Moisture Condition | Risk if Uncontrolled |
|---|---|---|
| 0–4 hours | Bleed water present, surface wet | Finishing too early traps bleed water |
| 4–24 hours | Surface begins losing moisture rapidly | Plastic shrinkage cracking |
| 1–7 days | Critical hydration window | Incomplete hydration, reduced final strength |
| 7–28 days | Continued slow hydration | Minor strength shortfall if cure stopped early |
| 28+ days | Internal moisture stabilizes | Minimal risk; strength gain continues slowly |
Why This Matters
The first 7 days are the most critical window for moisture retention — most permanent strength loss from poor curing happens in this period, not later.
Curing Mistakes to Avoid
Common errors that compromise strength, durability, or surface quality.
Removing forms too early
Stripping structural forms before adequate strength develops can cause sagging, cracking, or collapse.
Early vehicle traffic
Driving on concrete before 7 days causes surface damage and can create permanent tire ruts or cracking.
Poor moisture control
Letting the surface dry out during the first 7 days stalls hydration and permanently reduces final strength.
Inadequate curing time
Stopping curing measures before 7 days, especially in hot or windy conditions, leads to weaker, more crack-prone concrete.
Freezing temperatures
Concrete that freezes before reaching about 500 PSI can suffer permanent internal damage from ice crystal expansion.
Excessive heat
High temperatures accelerate surface drying faster than internal hydration, causing plastic shrinkage cracks.
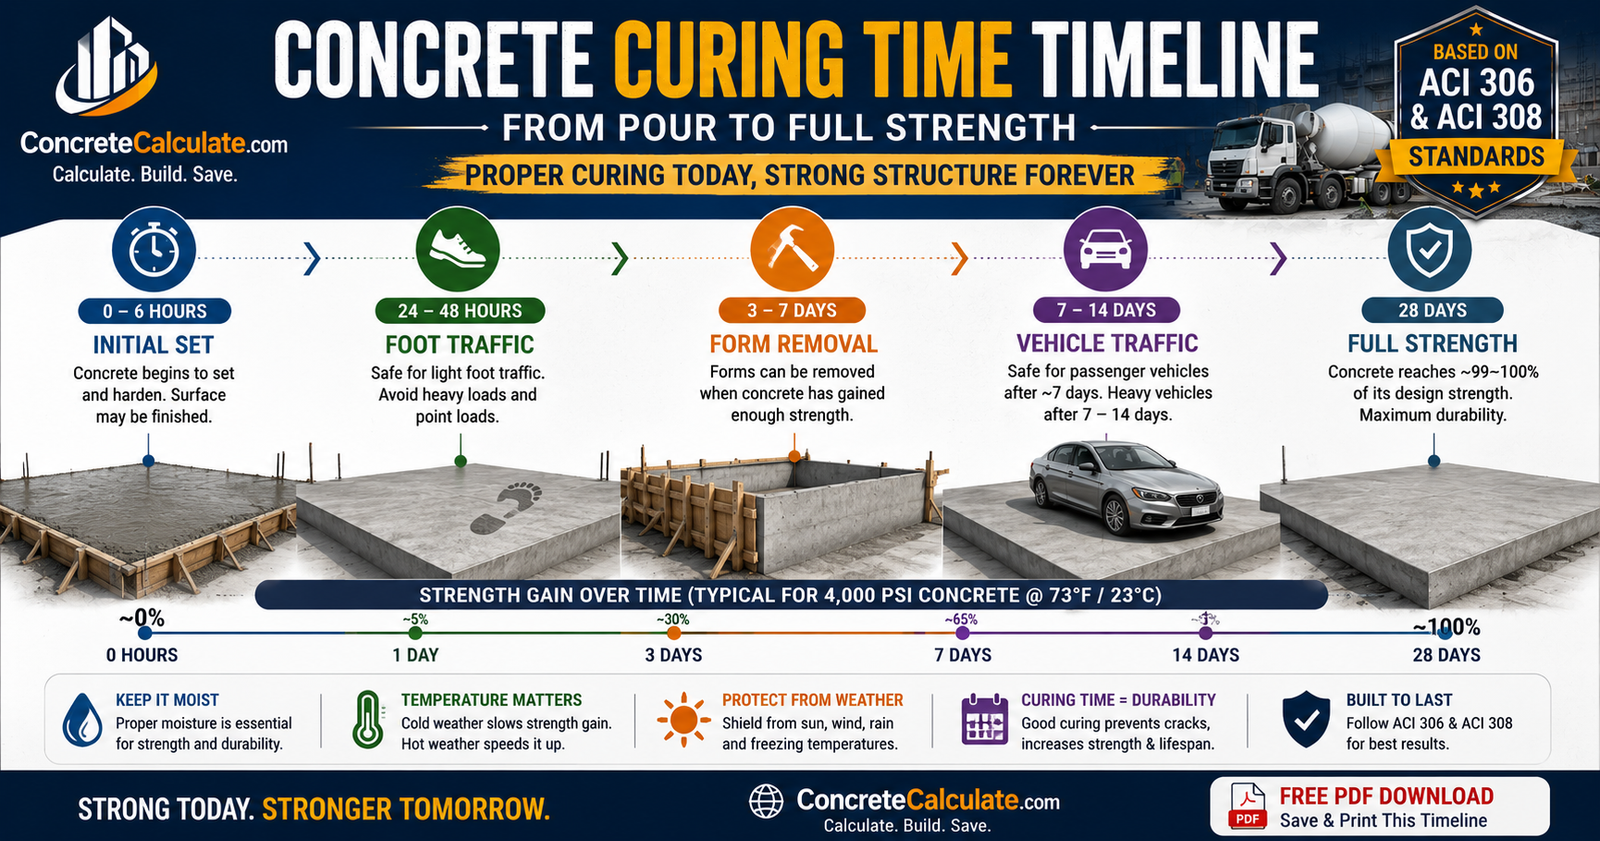
⭐ Visual Concrete Curing Timeline
Key milestones from placement to full strength, at a glance.
Contractor Worked Examples
Real-world curing timing decisions for common job scenarios.
Residential Driveway — Curing Schedule
Concrete Patio — Method Selection
Foundation Slab — Cold Weather Pour
Garage Floor — Vehicle Load Timing
Warehouse Slab — Commercial Schedule
Frequently Asked Questions
📥 Download Concrete Curing Time Chart PDF
Use your browser’s print function to instantly save this page as a PDF. This avoids broken file links and gives you an always up-to-date printable version for jobsite binders, estimating folders, and contractor reference kits.