UNF Thread Chart 2026 – Sizes, TPI, Pitch & Dimensions
UNF Thread Chart
Sizes, TPI, Pitch & Dimensions
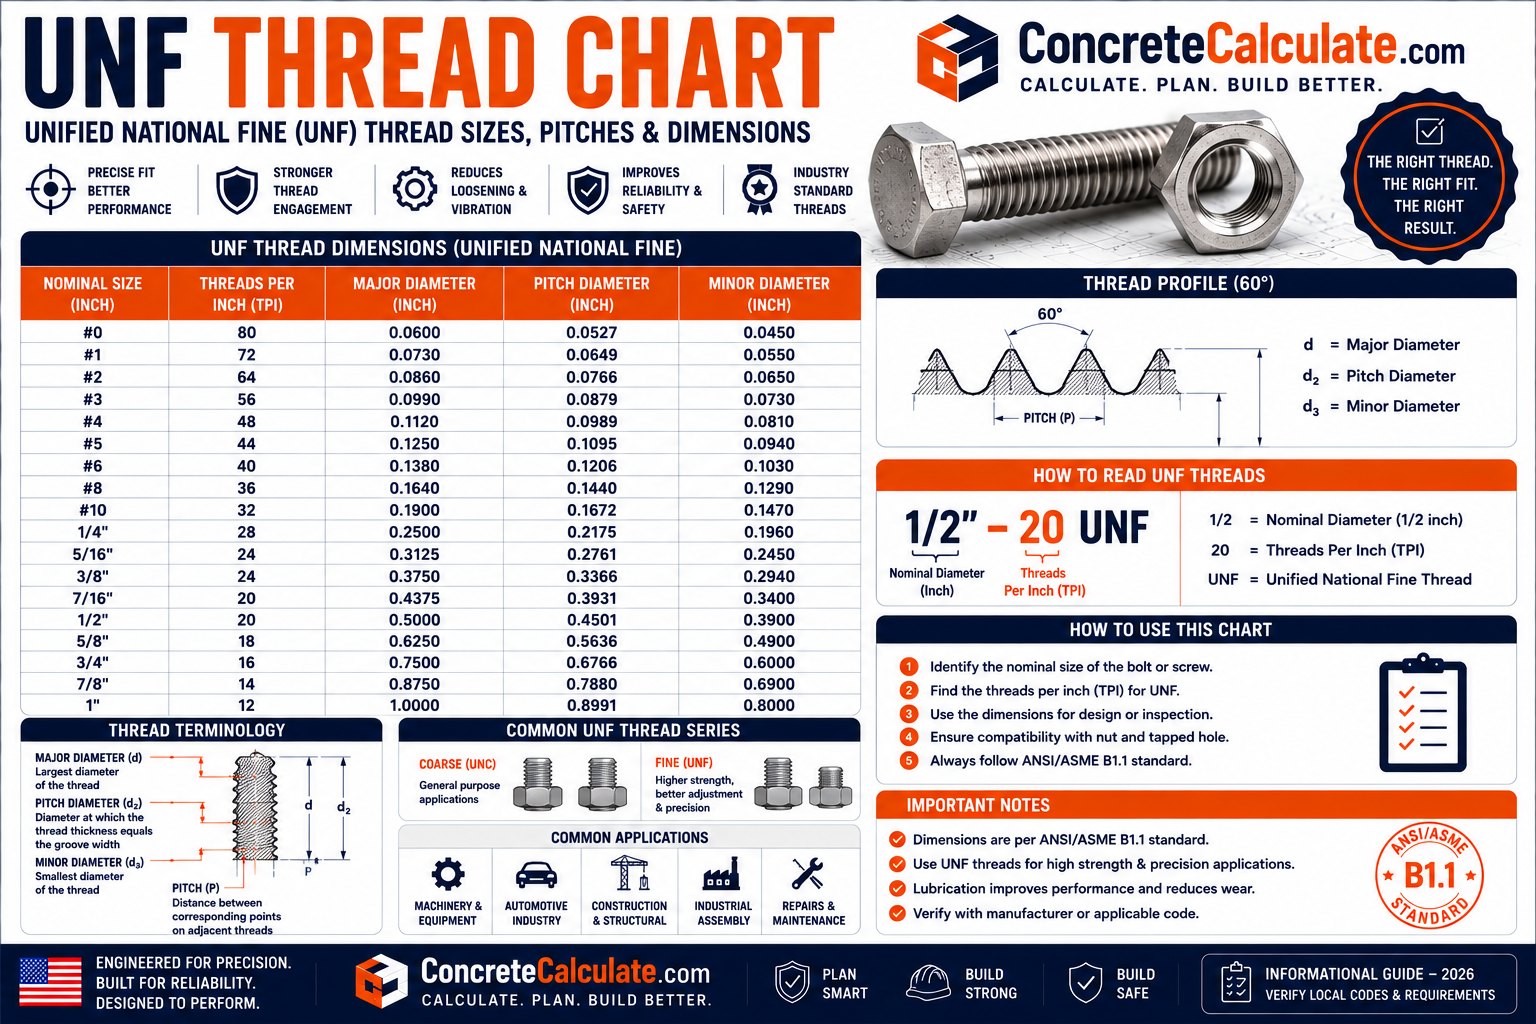
UNF is the fine pitch series of the Unified inch screw thread system. This chart covers screw and fractional sizes, TPI, dimensions, thread classes and identification, based on ASME B1.1.
 Reviewed by Muhammad Ramzan Babar, PhD Researcher & Calculator Developer · View Profile
This UNF Thread Chart completes the inch thread cluster alongside the UNC Thread Chart, Thread Pitch Chart, Thread Size Chart, Metric Thread Chart, Thread Identification Chart, Tap Drill Chart, NPT Thread Chart, and Bolt Torque Chart.
⭐⭐⭐ UNF Thread Chart: Quick Reference
Values calculated from ASME B1.1 Unified inch thread geometry formulas applied to standard basic major diameters and TPI.
| UNF Size | Nominal Diameter | TPI | Pitch (mm) | Designation |
|---|---|---|---|---|
| #0-80 | 0.060 in | 80 | 0.318 | #0-80 UNF |
| #1-72 | 0.073 in | 72 | 0.353 | #1-72 UNF |
| #2-64 | 0.086 in | 64 | 0.397 | #2-64 UNF |
| #3-56 | 0.099 in | 56 | 0.454 | #3-56 UNF |
| #4-48 | 0.112 in | 48 | 0.529 | #4-48 UNF |
| #5-44 | 0.125 in | 44 | 0.577 | #5-44 UNF |
| #6-40 | 0.138 in | 40 | 0.635 | #6-40 UNF |
| #8-36 | 0.164 in | 36 | 0.706 | #8-36 UNF |
| #10-32 | 0.190 in | 32 | 0.794 | #10-32 UNF |
| #12-28 | 0.216 in | 28 | 0.907 | #12-28 UNF |
| 1/4-28 | 0.250 in | 28 | 0.907 | 1/4-28 UNF |
| 5/16-24 | 0.3125 in | 24 | 1.058 | 5/16-24 UNF |
| 3/8-24 | 0.375 in | 24 | 1.058 | 3/8-24 UNF |
| 7/16-20 | 0.4375 in | 20 | 1.270 | 7/16-20 UNF |
| 1/2-20 | 0.500 in | 20 | 1.270 | 1/2-20 UNF |
| 9/16-18 | 0.5625 in | 18 | 1.411 | 9/16-18 UNF |
| 5/8-18 | 0.625 in | 18 | 1.411 | 5/8-18 UNF |
| 3/4-16 | 0.750 in | 16 | 1.588 | 3/4-16 UNF |
| 7/8-14 | 0.875 in | 14 | 1.814 | 7/8-14 UNF |
| 1-12 | 1.000 in | 12 | 2.117 | 1-12 UNF |
ASME B1.1 is the current governing U.S. standard for Unified inch screw threads, specifying thread form, series, class, allowance, tolerance and designation for UNC, UNF, UNEF and related thread forms.
⭐ What Is a UNF Thread?
UNF is the fine pitch thread series within the Unified inch screw thread system.
Unified National Fine
U = Unified, N = National, F = Fine, identifying the fine pitch series within ASME B1.1’s Unified thread system.
Fine pitch thread
UNF uses more threads per inch and a smaller pitch than UNC at the same nominal diameter.
Unified thread family
UNC (coarse), UNF (fine), and UNEF (extra fine) are three related series sharing the same 60 degree thread form but differing in thread spacing.
Simple example
1/2-20 UNF describes a 0.500 inch nominal diameter, fine pitch thread with 20 threads per inch.
⭐⭐⭐ UNF Thread Designation Explained
Reading a complete UNF designation correctly separates diameter, thread count, series and fit.
| Designation Part | Example (1/2-20 UNF-2A) | Meaning |
|---|---|---|
| 1/2 | 1/2 | Nominal major diameter |
| 20 | 20 | Threads per inch |
| UNF | UNF | Unified National Fine series |
| 2A | 2A | External thread class (standard general purpose fit) |
ASME B1.1 defines the complete designation, class, allowance, and tolerance system for Unified inch threads, ensuring 1/2-20 UNF-2A always refers to the same standardized diameter, pitch, series, and fit combination.
⭐⭐⭐ Master UNF Thread Size Chart
The complete engineering reference spanning numbered screw sizes through common fractional diameters.
| Size | Major Dia. (in) | TPI | Pitch (in) | Pitch Dia. (in, approx.) | Minor Dia. Ext. (in, approx.) |
|---|---|---|---|---|---|
| #0-80 | 0.0600 | 80 | 0.0125 | 0.0519 | 0.0465 |
| #1-72 | 0.0730 | 72 | 0.0139 | 0.0640 | 0.0580 |
| #2-64 | 0.0860 | 64 | 0.0156 | 0.0759 | 0.0691 |
| #3-56 | 0.0990 | 56 | 0.0179 | 0.0874 | 0.0797 |
| #4-48 | 0.1120 | 48 | 0.0208 | 0.0985 | 0.0894 |
| #5-44 | 0.1250 | 44 | 0.0227 | 0.1102 | 0.1004 |
| #6-40 | 0.1380 | 40 | 0.0250 | 0.1218 | 0.1109 |
| #8-36 | 0.1640 | 36 | 0.0278 | 0.1460 | 0.1339 |
| #10-32 | 0.1900 | 32 | 0.0312 | 0.1697 | 0.1562 |
| #12-28 | 0.2160 | 28 | 0.0357 | 0.1928 | 0.1773 |
| 1/4-28 | 0.2500 | 28 | 0.0357 | 0.2268 | 0.2113 |
| 5/16-24 | 0.3125 | 24 | 0.0417 | 0.2854 | 0.2674 |
| 3/8-24 | 0.3750 | 24 | 0.0417 | 0.3479 | 0.3299 |
| 7/16-20 | 0.4375 | 20 | 0.0500 | 0.4050 | 0.3834 |
| 1/2-20 | 0.5000 | 20 | 0.0500 | 0.4675 | 0.4459 |
| 9/16-18 | 0.5625 | 18 | 0.0556 | 0.5264 | 0.5024 |
| 5/8-18 | 0.6250 | 18 | 0.0556 | 0.5889 | 0.5649 |
| 3/4-16 | 0.7500 | 16 | 0.0625 | 0.7094 | 0.6823 |
| 7/8-14 | 0.8750 | 14 | 0.0714 | 0.8286 | 0.7977 |
| 1-12 | 1.0000 | 12 | 0.0833 | 0.9459 | 0.9098 |
Values calculated using standard 60 degree Unified thread profile formulas: pitch diameter = major diameter minus 0.649519 x pitch; external minor diameter = major diameter minus 1.082532 x pitch. These are theoretical basic dimensions; actual manufactured parts include tolerance allowances per ASME B1.1.
UNF Screw Sizes #0 Through #12
Numbered screw sizes use a gauge system common in small machine screws and precision hardware.
| Screw Number | Major Diameter (in) | UNF TPI |
|---|---|---|
| #0 | 0.0600 | 80 |
| #1 | 0.0730 | 72 |
| #2 | 0.0860 | 64 |
| #3 | 0.0990 | 56 |
| #4 | 0.1120 | 48 |
| #5 | 0.1250 | 44 |
| #6 | 0.1380 | 40 |
| #8 | 0.1640 | 36 |
| #10 | 0.1900 | 32 |
| #12 | 0.2160 | 28 |
⭐ UNF Fractional Thread Sizes
These sizes are the backbone of automotive and precision mechanical fastening.
1/4-28 UNF ⭐
One of the most commonly encountered UNF sizes, used across automotive and general mechanical assembly.
5/16-24 UNF
Common in automotive and moderate load fine-thread applications.
3/8-24 UNF ⭐
Frequently used in automotive and precision mechanical assembly.
7/16-20 UNF
Used in moderate to heavier fine-thread fastening applications.
1/2-20 UNF ⭐⭐⭐
One of the most recognized UNF sizes, widely referenced in automotive and mechanical engineering contexts.
5/8-18 UNF
Common in heavier automotive and industrial fine-thread applications.
3/4-16 UNF
Used in heavier mechanical and industrial fine-thread connections.
7/8-14 and 1-12 UNF
Used in larger mechanical and industrial applications requiring fine thread engagement.
⭐⭐⭐ UNF Major, Pitch & Minor Diameter
These dimensions give the chart genuine engineering reference value beyond a simple TPI list.
Major diameter
The largest diameter of the thread, measured at the crest for external threads. This equals the nominal size stated in the designation, such as 0.5000 inches for 1/2-20 UNF.
Pitch diameter ⭐⭐⭐
An imaginary cylinder diameter where thread width equals groove width. This is the primary reference dimension used for thread measurement, inspection, and gaging, and directly relates to thread class and tolerance.
Minor diameter (external)
The smallest diameter of the external thread, measured at the root. Relates directly to tensile stress area and fastener strength calculations.
Minor diameter (internal)
The smallest diameter of the internal (nut) thread, measured at the crest of the internal thread rather than the root, since internal and external threads are not dimensionally identical at every point along the profile.
Internal and external thread minor diameters use different calculation references and tolerance allowances; presenting them as a single ambiguous value can lead to incorrect fit or clearance assumptions.
⭐⭐⭐ UNC vs UNF Thread Chart
Same nominal diameter, different thread spacing. This is the defining comparison for the entire Unified thread system.
| Feature | UNC | UNF |
|---|---|---|
| Series | Coarse | Fine |
| TPI at 1/2 inch | 13 | 20 |
| Pitch at 1/2 inch | 0.0769 in (1.954 mm) | 0.0500 in (1.270 mm) |
| Thread spacing | Wider | Closer |
| Typical use | General fastening, construction | Automotive, precision assembly, thin materials |
| Diameter | UNC Designation | UNF Designation |
|---|---|---|
| 1/4 in | 1/4-20 UNC | 1/4-28 UNF |
| 5/16 in | 5/16-18 UNC | 5/16-24 UNF |
| 3/8 in | 3/8-16 UNC | 3/8-24 UNF |
| 1/2 in | 1/2-13 UNC | 1/2-20 UNF |
| 5/8 in | 5/8-11 UNC | 5/8-18 UNF |
| 3/4 in | 3/4-10 UNC | 3/4-16 UNF |
Both share an identical 0.500 inch major diameter, but 1/2-13 UNC has 13 threads per inch while 1/2-20 UNF has 20 threads per inch. This is why diameter alone can never identify a thread series; TPI measurement is always required.
⭐⭐⭐ UNF vs UNEF vs Metric Thread
Comparing UNF against related and unrelated systems clarifies when each applies.
| Feature | UNF | UNEF | Metric |
|---|---|---|---|
| Series name | Unified Fine | Unified Extra Fine | ISO metric |
| TPI at same diameter | Higher than UNC | Highest | N/A (pitch in mm) |
| Typical use | Automotive, precision assembly | Instruments, thin wall tubing | Global general fastening |
| Example at 1/2 in | 1/2-20 UNF | 1/2-28 UNEF | M12 x 1.5 (nearest metric) |
| Governing standard | ASME B1.1 | ASME B1.1 | ISO 261/262 |
A 1/2-20 UNF bolt (12.7 mm diameter, 1.27 mm pitch) is not the same as an M12 x 1.5 bolt (12 mm diameter, 1.5 mm pitch), despite superficially similar size. Different diameter, different pitch, different standard, different tolerance. Never force one system’s nut onto the other system’s bolt.
“SAE thread” is sometimes used informally for inch fasteners in general conversation, but identifying the actual series, UNC, UNF, or UNEF, is more precise and avoids ambiguity. UNEF availability is limited compared to UNF; not every diameter has a common UNEF option.
⭐⭐⭐ UNF Thread Classes: 1A/2A/3A & 1B/2B/3B
Thread class describes fit and tolerance, completely separate from diameter and TPI.
| Class | Thread Type | Fit | Typical Use |
|---|---|---|---|
| 1A | External | Loosest general fit | Quick assembly, rough conditions |
| 2A | External | Standard general purpose fit | Most common commercial UNF bolts and screws |
| 3A | External | Closest fit, no allowance | Precision applications requiring tight fit |
| 1B | Internal | Loosest general fit | Quick assembly, rough conditions |
| 2B | Internal | Standard general purpose fit | Most common commercial UNF nuts and tapped holes |
| 3B | Internal | Closest fit | Precision applications |
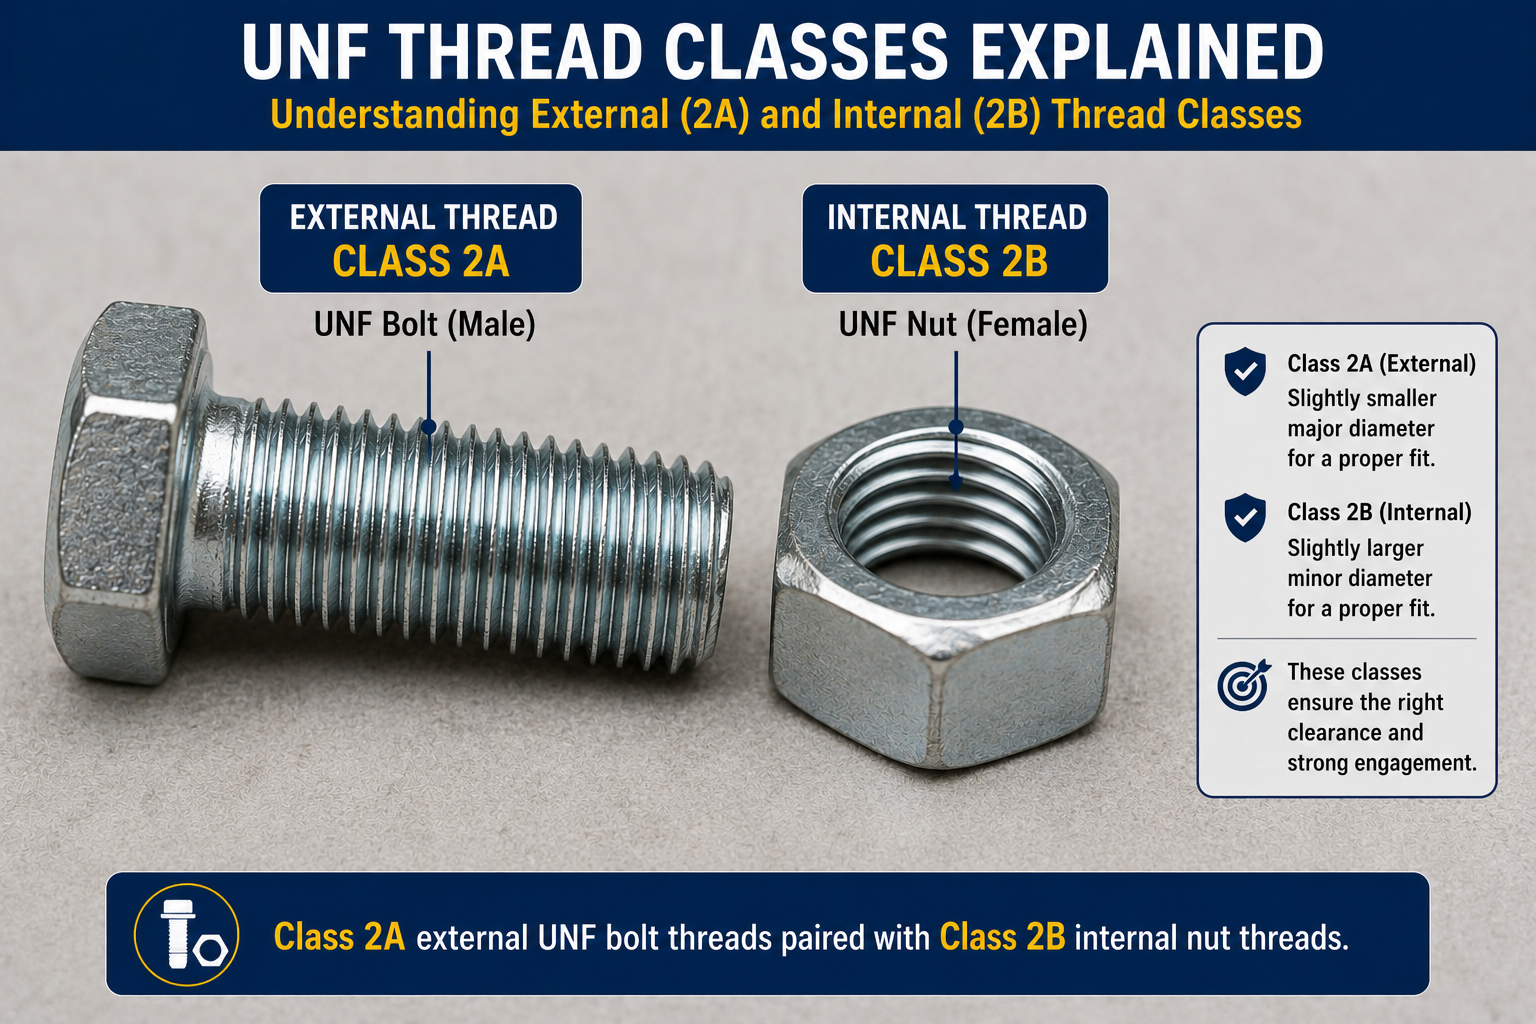
2A describes the external thread on a UNF bolt or screw, while 2B describes the internal thread in the mating nut or tapped hole. 2A/2B is the standard general purpose combination used for most commercial UNF fasteners. Class does not determine mechanical strength; it determines fit and manufacturing tolerance only.
ASME B1.1 defines allowance and tolerance mathematically for each class as a function of nominal diameter, thread length of engagement, and pitch. Class 3 removes the allowance entirely and uses a tighter tolerance band than Class 2.
⭐⭐⭐ Why Use Fine Threads?
UNF offers specific engineering characteristics, but is not universally superior to UNC.
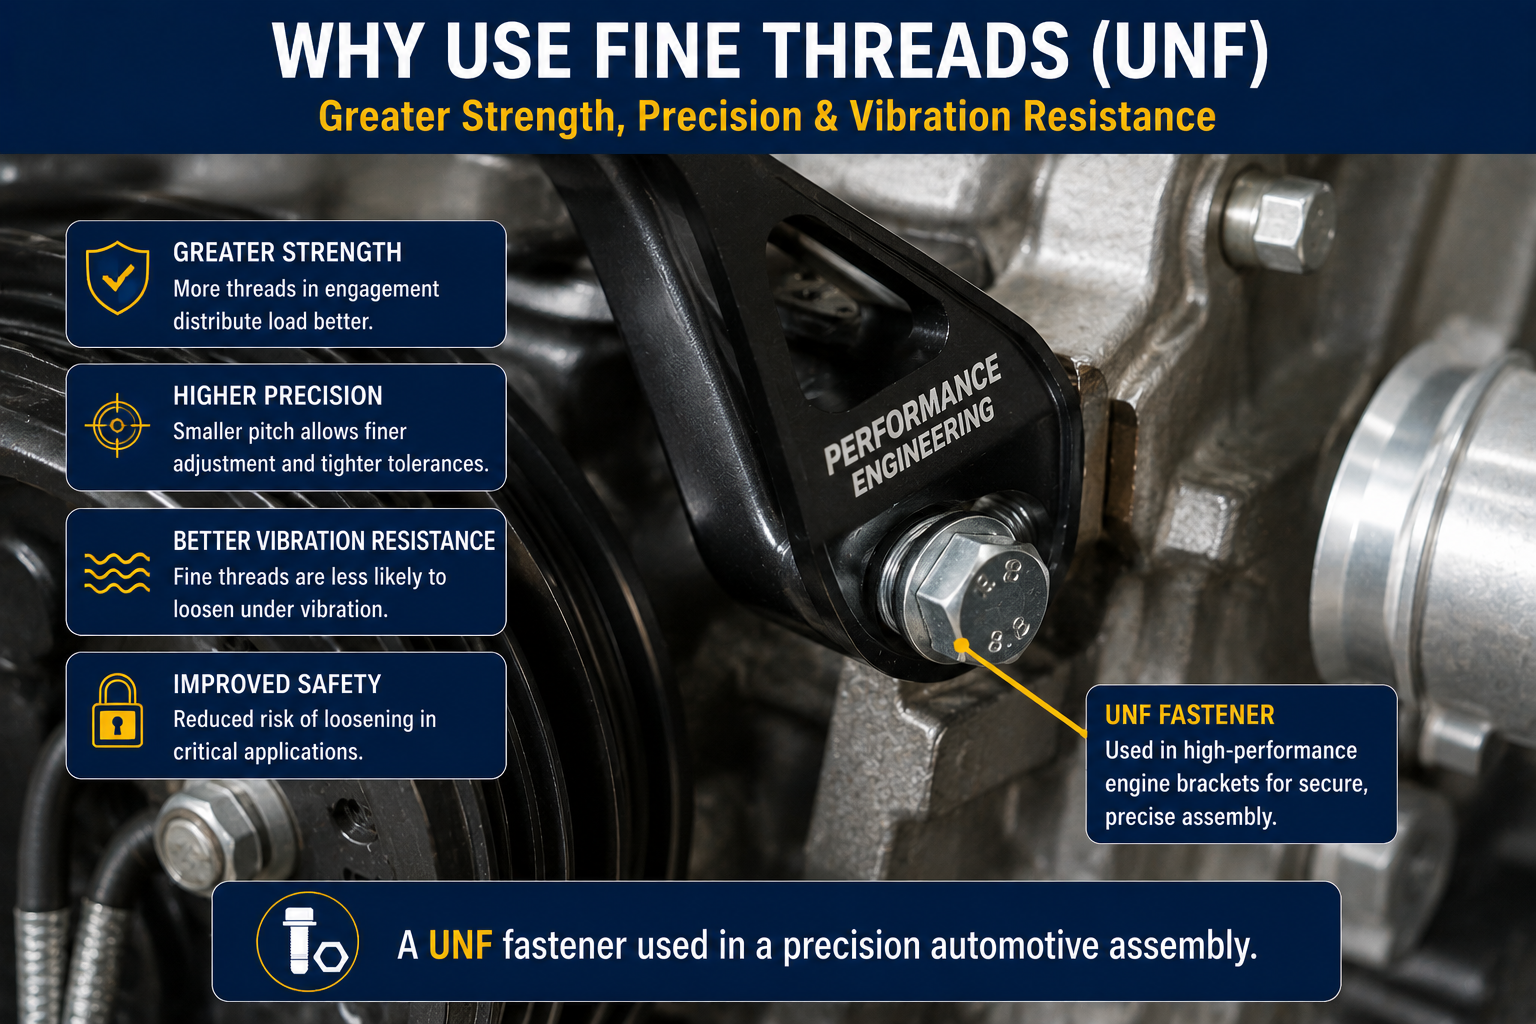
Potential advantages
- More threads per inch, offering finer adjustment
- Smaller pitch, which can suit certain engagement geometries
- Slightly larger tensile stress area at the same nominal diameter
- Useful where wall thickness or clearance is limited
Potential limitations
- More susceptible to cross-threading during assembly
- More sensitive to thread damage than coarser threads
- Less forgiving in dirty, rough, or corroded conditions
- Can assemble more slowly due to higher thread count
Fine threads can offer useful engineering characteristics in specific applications, but the correct choice depends on the joint design, materials, engagement length, loading conditions, manufacturing requirements, and applicable specification. The Unified thread standard defines thread geometry; it does not make UNF a universally superior fastener choice over UNC.
Thin materials
Fine threads may be selected where available radial or axial space is limited, since the shallower thread depth can suit thin-walled parts.
Vibration-sensitive applications
Fine threads are sometimes selected in vibration-sensitive contexts as part of a broader engineering rationale, but UNF alone does not guarantee vibration resistance; proper torque, locking features, and joint design remain essential.
⭐⭐⭐ UNF Thread Identification
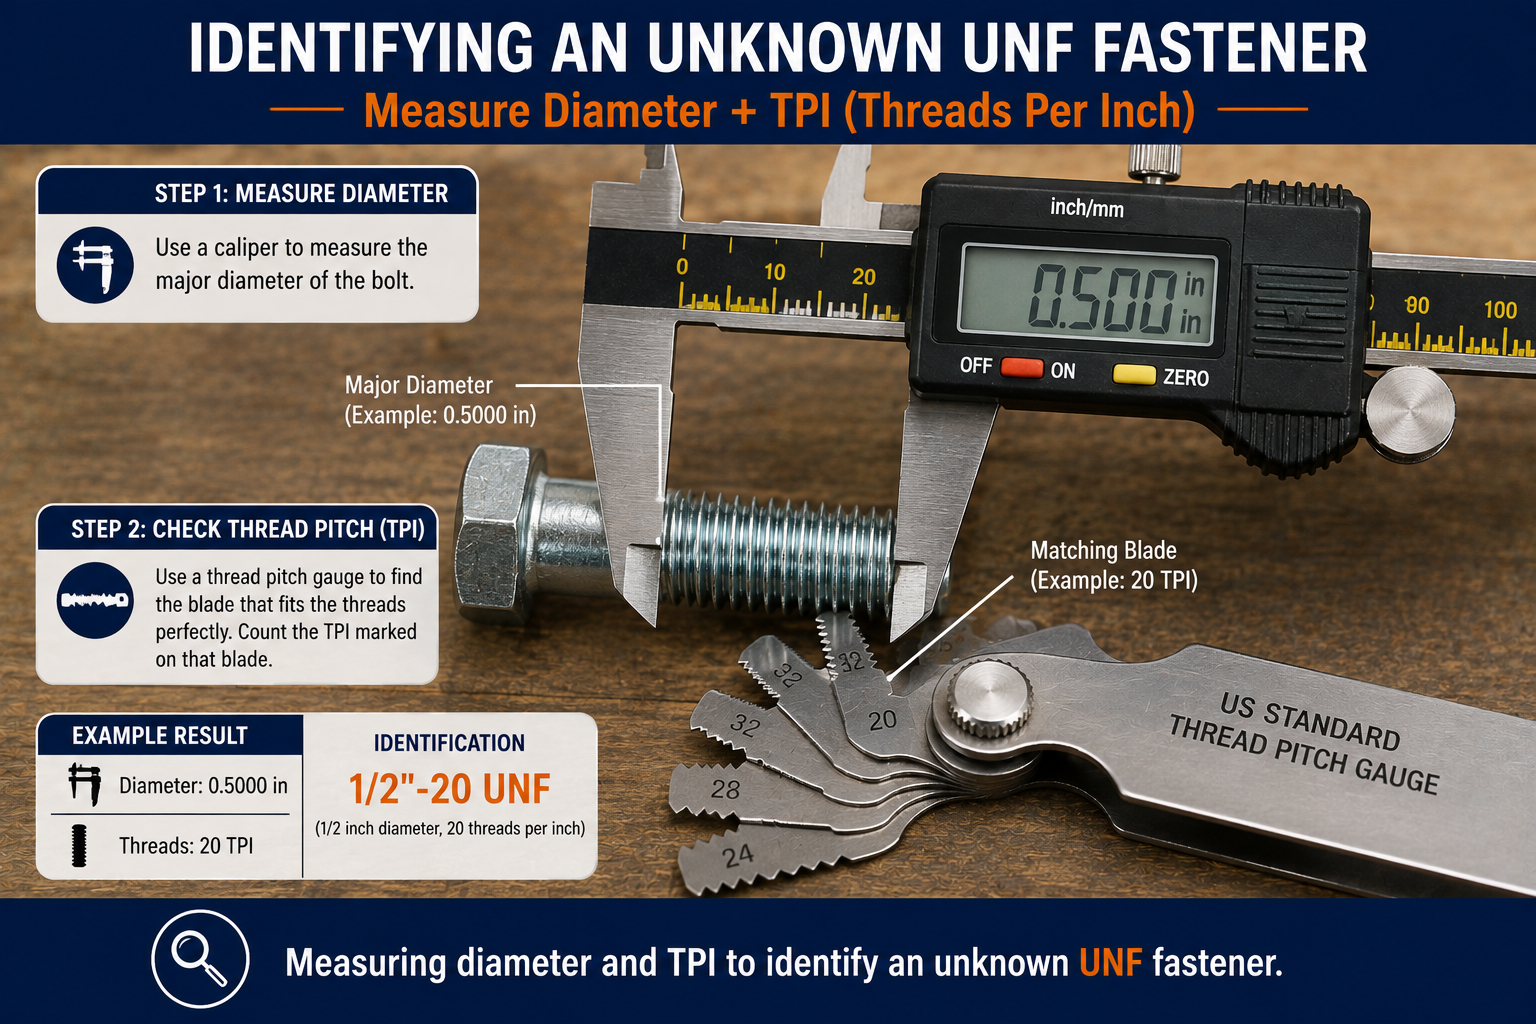
Identifying an unknown UNF fastener requires both diameter and TPI measurement.
Use a caliper on the major diameter of the external thread.
Use an inch thread pitch gauge or count threads within one inch.
Match both diameter and TPI together against the standard chart.
Verify the measured TPI is the higher fine value, not the lower coarse value, for that diameter.
For precision applications, confirm 2A/2B or the applicable class.
Thread a known nut on carefully by hand; stop if resistance occurs.
Same diameter, different TPI, equals different thread series. Measuring 13 TPI at 0.500 inches indicates 1/2-13 UNC; measuring 20 TPI at the same diameter indicates 1/2-20 UNF.
Always combine diameter and TPI together rather than relying on TPI in isolation, since some TPI values can be shared across different nominal sizes within the broader Unified system.
⭐⭐⭐ UNF Tap Drill Chart
Calculated using the cutting tap formula at approximately 75 percent thread engagement, a common general reference basis, consistent with the methodology on the main Tap Drill Chart.
| UNF Thread | TPI | Calculated Drill at 75% (in) | Nearest Standard Drill |
|---|---|---|---|
| #10-32 | 32 | 0.1590 | #21 |
| 1/4-28 | 28 | 0.2152 | #3 |
| 5/16-24 | 24 | 0.2719 | Letter I |
| 3/8-24 | 24 | 0.3344 | Letter R |
| 7/16-20 | 20 | 0.3888 | Letter X |
| 1/2-20 | 20 | 0.4513 | 29/64 in |
| 5/8-18 | 18 | 0.5709 | 37/64 in |
| 3/4-16 | 16 | 0.6891 | 11/16 in (close approx.) |
Drill diameter (in) = Major diameter minus [(0.01299 x desired percent of thread) / TPI], evaluated at 75 percent engagement. This matches the same cutting-tap formula and reference basis used on the main Tap Drill Chart. Do not assume 75 percent is mandatory; actual desired engagement depends on material and application.
UNF Thread Engagement, Strength, Grade & Torque
Thread series describes geometry only, not material strength or required torque.
Thread engagement
Required engagement length depends on the tapped material’s strength relative to the fastener, not on TPI alone; a fine thread does not automatically reduce the needed engagement length.
UNF thread strength
Tensile stress area, combined with material grade, determines actual tensile capacity. UNF’s slightly larger tensile stress area at the same nominal diameter is one input, not the deciding factor for overall joint strength.
UNF does not equal bolt grade
A Grade 2, Grade 5, and Grade 8 bolt can all use identical 1/2-20 UNF threads. Thread series and material grade are independent properties. See the Bolt Grade Chart.
UNF and bolt torque
Correct tightening torque depends on bolt grade, lubrication, coating, friction, and required preload, not the UNF designation alone. See the Bolt Torque Chart.
⭐ UNF vs NPT & BSP Thread
UNF is a parallel fastener thread, fundamentally different from tapered pipe thread systems.
| Feature | UNF | NPT |
|---|---|---|
| Application | Fasteners (bolts, screws, nuts) | Pipe/fittings |
| Thread profile | Straight, parallel | Tapered (1:16) |
| Example | 1/2-20 UNF | 1/2 NPT |
These are completely different thread systems despite superficially similar size labels. NPT is a tapered pipe thread; UNF is a straight fastener thread. See the NPT Thread Chart for full pipe thread reference. BSP is a separate British pipe thread family and should also not be confused with Unified inch fastener threads like UNF.
⭐⭐⭐ UNF Thread Applications
UNF is widely used where precision, thin materials, or established manufacturer specifications call for a fine thread.
Automotive
Common in engine components, brackets, and precision hardware; always follow the vehicle manufacturer’s service specification for safety-critical fasteners rather than a general assumption.
Aerospace
Fine threads are used in specific aerospace fastening applications governed by the applicable engineering specification.
Machinery and industrial equipment
Used across general machinery and industrial assemblies, particularly where finer adjustment or thin-section engagement is beneficial.
Precision assemblies
Selected where finer thread adjustment or tighter tolerance is required by the design.
Construction equipment ⭐
UNF fasteners appear in construction machinery, specialty brackets, and mechanical assemblies; keep structural fastening requirements (governed by their own specification) separate from generic UNF sizing decisions.
General fastening
UNF remains a viable choice for many general applications where its characteristics suit the specific joint design.
⭐ UNF Size by Size Reference
Quick individual comparisons against the corresponding UNC size at the same diameter.
1/4-28 UNF ⭐
Major diameter 0.250 in, 28 TPI, pitch 0.0357 in (0.907 mm). Compare with 1/4-20 UNC (20 TPI) at the identical diameter.
3/8-24 UNF ⭐
Major diameter 0.375 in, 24 TPI, pitch 0.0417 in (1.058 mm). Compare with 3/8-16 UNC (16 TPI) at the identical diameter.
1/2-20 UNF ⭐⭐⭐
Major diameter 0.500 in, 20 TPI, pitch 0.0500 in (1.270 mm). Compare directly with 1/2-13 UNC (13 TPI); same diameter, different pitch, different designation.
5/8-18 UNF
Major diameter 0.625 in, 18 TPI, pitch 0.0556 in (1.411 mm). Compare with 5/8-11 UNC (11 TPI) at the identical diameter.
3/4-16 UNF
Major diameter 0.750 in, 16 TPI, pitch 0.0625 in (1.588 mm). Compare with 3/4-10 UNC (10 TPI) at the identical diameter.
#10-32 UNF
Major diameter 0.190 in, 32 TPI, pitch 0.0312 in (0.794 mm). One of the most common small UNF sizes in machine screw applications.
⭐⭐⭐ UNF Thread Visual Guide
Original diagrams built to explain UNF anatomy, the UNC/UNF comparison, and identification.
How to Choose a UNF Thread
Follow this workflow rather than assuming a size from appearance alone.
Identify the actual nominal size needed for the application.
Verify the application specification actually calls for UNF rather than UNC.
Confirm the standard fine TPI for that diameter.
Select 2A/2B for general purpose use, or 1A/1B and 3A/3B for looser or tighter fit requirements.
Confirm identical diameter, TPI and compatible class.
Confirm the material grade meets the application’s strength requirement separately from thread selection.
Automotive, aerospace and equipment manufacturer specifications override generic charts.
⭐⭐⭐ UNF Thread Worked Examples
These examples demonstrate the identification, comparison, and conversion process.
1. Identify a 1/2-Inch UNF Bolt
2. Identify a 3/8-Inch UNF Bolt
3. UNC vs UNF Comparison
4. Convert UNF Pitch
5. Identify a Small UNF Screw
Common UNF Thread Mistakes
Most UNF thread problems trace back to one of these errors.
❌ Confusing UNF with UNC
Same diameter, different TPI; always verify thread count directly.
❌ Confusing UNF with UNEF
Both are fine series but with different TPI; verify the exact value.
❌ Measuring diameter only
Diameter alone cannot distinguish UNC from UNF or confirm the exact series.
❌ Measuring TPI only
Combine TPI with a verified diameter reading for a reliable identification.
❌ Confusing pitch and TPI
Pitch is a distance; TPI is a count. Convert carefully rather than mixing them.
❌ Assuming UNF means a specific bolt grade
UNF describes geometry only, not material strength or grade.
❌ Assuming UNF and metric are interchangeable
Numerically close sizes across systems are still not interchangeable.
❌ Using the wrong nut
A nut must match diameter, TPI, thread form and compatible class exactly.
❌ Ignoring thread class
Class describes fit; two threads sharing size and TPI can still differ in tolerance.
❌ Using a generic torque value
Correct torque depends on grade, lubrication and friction, not UNF designation alone.
❌ Using the wrong tap drill
UNF requires its own tap drill values distinct from UNC at the same diameter.
❌ Calling NPT a UNF thread
NPT is a tapered pipe thread, completely different from the straight UNF fastener thread.
Frequently Asked Questions
📄 Download UNF Thread Chart PDF
Use the print button to create a print-ready or downloadable reference. Always verify against the current ASME B1.1 standard for critical applications.
Cite or Embed This Chart
Copy the page-wide citation to reference the complete UNF Thread Chart.