
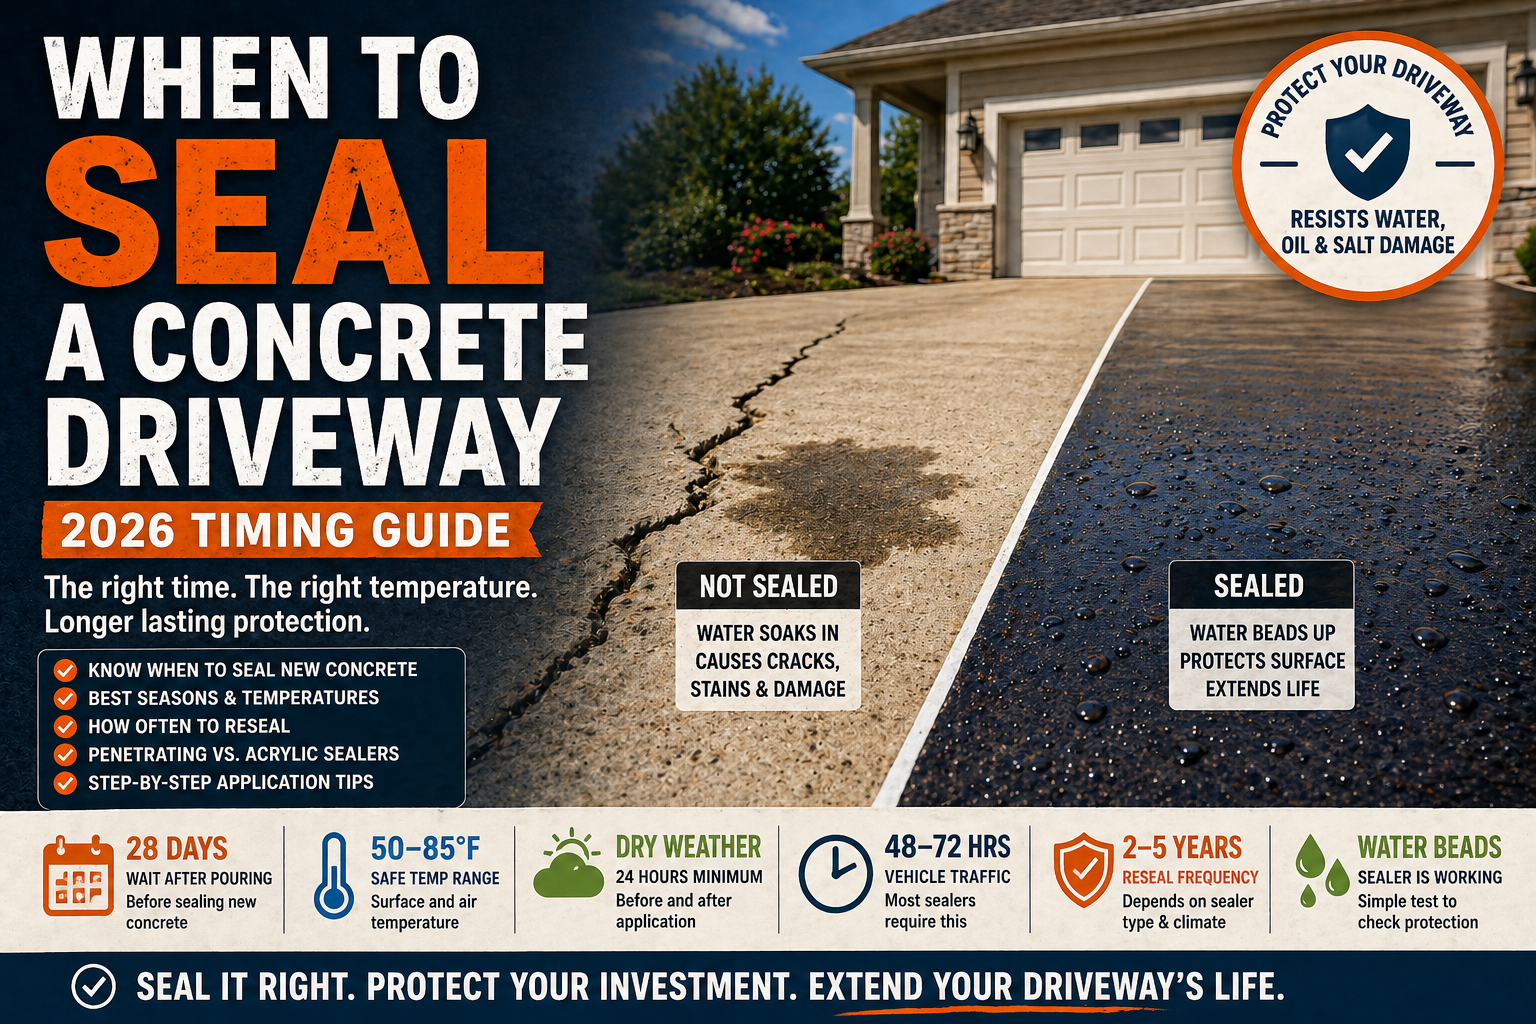
Sealing a concrete driveway at the wrong time is one of the most common homeowner mistakes. Apply it too early on new concrete and you trap moisture inside. Seal it in cold weather and it peels. Skip it entirely and the surface absorbs water, stains, and deicing salts until cracks start spreading. This guide explains exactly when to seal a concrete driveway, how long to wait after a new pour, the right temperature range, how often to reseal, and which type of sealer works best for US driveways.
Why Sealing a Concrete Driveway Matters
Concrete is porous. Without a sealer, it absorbs water, motor oil, deicing salts, and stains directly into the slab. In freeze-thaw climates across the Midwest, Northeast, and Mountain states, that absorbed water expands when it freezes and chips the surface from the inside. That process is called spalling, and once it starts, it spreads fast.
Sealing reduces water absorption, slows surface wear, and helps resist salt damage through winter. It does not make concrete indestructible, but it significantly extends the life of the slab and reduces how often you need to patch or resurface a worn driveway.
Even in warmer states like Texas, Florida, and California where freeze-thaw cycles are not a factor, sealing still protects against oil stains, UV fading, and general surface breakdown from traffic and sun. If you are comparing materials for a new driveway, read Concrete vs. Asphalt Driveways for a side-by-side look at long-term maintenance needs.
How Long to Wait on New Concrete
The most common question after a new driveway is poured: how long before sealing new concrete driveway? The answer for a standard surface sealer is at least 28 days.
Fresh concrete goes through a chemical process called hydration as it cures. That process takes roughly 28 days to reach adequate strength. If you apply a film-forming or penetrating sealer before the slab has cured, you trap moisture inside. That leads to bubbling, cloudiness, surface peeling, and weakened concrete under the sealer coat.
There is one exception. Cure-and-seal products can be applied very early, sometimes within 24 to 48 hours after the bleed water has disappeared from the surface. These are specifically formulated compounds designed to both cure and seal at the same time. They are not the same as standard driveway sealers. If you want a high-gloss acrylic finish or a penetrating water repellent, wait the full 28 days.
Sealing a new driveway too early is one of the top causes of sealer failure. The trapped moisture has nowhere to go and causes the coating to delaminate within one season. Your driveway cost too much to rush the final step. See the full Concrete Curing and Drying Time Guide for a detailed breakdown of the 28-day curing process.
While waiting for the slab to cure, also be careful about when you let vehicles on it. Most residential driveways can handle foot traffic after 24 to 48 hours, but vehicles should stay off for at least 7 days. Read When Can You Drive on Concrete for a full timeline by concrete type and weather conditions.
If you are still planning the pour, use the Concrete Driveway Calculator for material estimates and the Concrete Driveway Cost Calculator for full project pricing. The full step-by-step pour process is covered in How to Pour a Concrete Driveway.
Best Season to Seal a Concrete Driveway
The best time to seal a concrete driveway is late spring through early fall in most US regions. That typically means May through early October. Temperatures are stable, rain is more predictable, and you can get the multi-day dry window the sealer needs to cure properly.
Spring
Spring is the most popular time for driveway sealing across the US. Temperatures are moderate, humidity is manageable, and sealing in spring gives the coating a full summer to cure before winter arrives. In freeze-thaw climates, a spring seal coat directly reduces the salt and ice damage that happens the following winter.
Early fall
Early fall also works well if temperatures are still consistently above 50 degrees F and the forecast is stable. In the South and Southwest, fall is often cooler and less humid than summer, making it a practical alternative to spring. Avoid late fall in the northern states, where overnight freezes can arrive without much warning.
Summer caution
Hot summer days above 90 degrees F cause some sealers to dry too fast, trapping air bubbles and leaving an uneven finish. If you seal in summer, plan to work early in the morning while the driveway is still in shade. Review Pouring Concrete in Hot Weather for how heat affects concrete products and Concrete Temperature Limits for the full safe working range.
When not to seal
-
>When temperatures are below 50 degrees F
>When overnight temps will drop below 50 F in the first 24 hours after sealing
>When rain is forecast within 24 hours of application
>When the surface is still damp from recent rain
>In direct mid-afternoon sun on a hot day above 90 degrees F
For context on how moisture affects fresh concrete products, also read Pouring Concrete in the Rain. For planning future pours around ideal weather conditions, see Best Time to Pour Concrete.
Temperature and Weather Requirements
Temperature is the most controllable factor in a successful sealing job. The range is simple to remember.
-
>Minimum air and surface temp: 50 degrees F
>Maximum temp: 85 to 90 degrees F
>Overnight low for first 24 hours: Must stay above 50 F
>Rain-free window: At least 24 hours before and after sealing
>Wind: Avoid high wind days – debris and fast evaporation hurt the finish
Surface temperature and air temperature often differ by 10 to 20 degrees F on a sunny afternoon. A concrete slab in direct summer sun can be far hotter than the air above it. If you want to be precise, use an infrared thermometer to check the surface before you start. Many sealer manufacturers recommend checking both air and surface temperature before applying.
🌞 Example: Ideal Sealing Day in the Midwest
Date: Mid-May morning in Ohio
Air temperature at 8am: 62 degrees F
Surface temperature: 58 degrees F in morning shade
Forecast: Clear and dry for the next 48 hours
Overnight low: 54 degrees F
Wind: Light, under 10 mph
Result: Ideal conditions. Sealer bonds evenly, cures correctly, and provides maximum protection going into the summer and next winter.
Signs Your Driveway Needs Sealing Now
If you already have an existing concrete driveway, here is a quick test. Sprinkle water on the surface. If it beads up and rolls off, the sealer is still working. If the water soaks in and darkens the concrete within a few seconds, the sealer has worn off and it is time to reseal.
Other clear signs the driveway needs sealing:
-
>Surface looks faded, dull gray, or washed out
>Hairline cracks or pitting are forming across the surface
>Oil and fluid stains are soaking in instead of sitting on top
>Deicing salt damage appears as pitting, flaking, or spalling
>Water no longer beads after rain
>The last seal application was more than 3 years ago
If you also notice active cracks, repair those before sealing. A sealer goes over a sound surface – it does not fill structural cracks or fix spalling. See Why Is My Concrete Cracking to diagnose the cause first. If the surface needs more than sealing, use the Concrete Resurfacing Calculator to estimate resurfacer material.
Penetrating vs. Film-Forming Sealer
The right sealer type changes how often you need to reapply and how the driveway looks afterward.
| Feature | Penetrating Sealer | Film-Forming Acrylic Sealer |
|---|---|---|
| How it works | Absorbs into pores, reacts chemically below the surface | Forms a visible protective film on top of the surface |
| Appearance | Natural look, no visible sheen | Adds gloss, wet look, or matte finish |
| Lifespan | 5 to 10 years | 1 to 3 years depending on traffic and climate |
| Best climate | Freeze-thaw climates, heavy deicing salt use | Mild climates, decorative driveways |
| Tire mark risk | Low | Higher with acrylic film coats |
| Cost per gallon (2026) | $40 to $80 | $20 to $50 |
| Reapplication prep | Usually clean and reapply | May need to strip failing coat first |
For most residential driveways in the US, a silane-siloxane penetrating sealer is the better long-term investment. It lasts longer, handles freeze-thaw stress well, does not peel, and does not change how the concrete looks. Film-forming acrylic sealers are a reasonable choice when appearance matters more than longevity and you are comfortable reapplying every couple of years.
Penetrating sealers typically cover 150 to 250 square feet per gallon depending on concrete porosity. Film-forming acrylics cover 200 to 400 square feet per gallon. Use the Concrete Sealer Calculator to find exactly how many gallons you need for your driveway dimensions before purchasing.
How to Apply Concrete Driveway Sealer
Getting the timing right is only part of the job. Application technique determines whether the sealer bonds evenly and lasts its full expected life.
Step 1 – Clean the surface thoroughly
Pressure wash the entire driveway. Use a concrete degreaser or cleaner on any oil, grease, or rust stains. Old embedded oil stains that are not treated first will bleed back through a film-forming sealer. Let the surface dry completely before applying anything.
Step 2 – Fill any cracks first
Use a concrete crack filler for visible cracks and let it cure per the product instructions before sealing over it. A sealer coats the surface but it does not fill a structural crack. For more on crack repair before sealing, check How Thick Should a Concrete Driveway Be if you suspect the slab itself has a depth or strength issue.
Step 3 – Strip any failing old sealer
If the old sealer is peeling, flaking, or bubbling, strip it before reapplying. Chemical strippers or mechanical grinding remove the old coat. Applying fresh sealer over a failing base gives you a fresh-looking failure within one season.
Step 4 – Apply the first coat thin and even
Use a garden pump sprayer for penetrating sealers or a 3/8-inch nap roller for acrylic film sealers. Work in parallel passes with slight overlaps. The coat should be thin and even with no pooling. Puddles of sealer on the surface create hazy spots after curing.
Step 5 – Apply the second coat in the opposite direction
Wait for the first coat to become tacky or touch-dry, usually 2 to 4 hours depending on conditions. Apply the second coat running perpendicular to the first. Two thin coats bond better than one heavy coat in every case.
Thin is always better than thick. A heavy single coat is the number one reason sealers bubble, cloud, or peel within the first season. Spread the sealer evenly and keep moving. Back-roll or redistribute any wet spots before they set.
Driveway Sealer Drying Time
Driveway sealer drying time varies by product, temperature, and humidity. These are the general timelines you can count on across most US residential products.
-
>Foot traffic: 24 hours minimum
>Vehicle traffic: 48 to 72 hours
>Full cure: Up to 7 days for film-forming sealers in cool or humid conditions
Higher temperatures and low humidity speed up the process. Cold, overcast, or humid days slow it. If temperatures drop below 50 F overnight during the first 24 hours after sealing, the product may not cure correctly and could require reapplication.
Parking on a freshly sealed acrylic driveway too soon is one of the most common ways to ruin the finish. Hot summer tires on a film coat that has not fully set will leave permanent tire impressions. Penetrating sealers are more forgiving in this regard since there is no film to imprint.
Always read the manufacturer label before starting. Some products have different requirements based on their formulation, regional climate, or specific PSI ratings. Use the Concrete Curing Temperature Calculator to check whether your conditions fall in the safe range.
How Often to Reseal a Concrete Driveway
How often to seal a concrete driveway depends on the sealer type, your climate, and how heavily the driveway is used.
-
>Film-forming acrylic sealer: every 2 to 3 years in most climates, annually in harsh freeze-thaw areas
>Penetrating silane-siloxane sealer: every 5 to 10 years
>Heavy-use driveways in northern states: check every 2 years regardless of product type
>Low-traffic driveways in warm climates: may go 4 to 5 years between coats
The water bead test is the most reliable indicator. If water soaks into the concrete surface rather than beading, the sealer has worn off. Do not wait until the driveway shows visible deterioration before resealing. Preventive resealing on a sound surface is always cheaper than repairing or replacing a damaged one.
Avoid resealing too frequently. Applying a film-forming sealer every year can build up layers that bond poorly to each other, eventually leading to the entire coating peeling away. Only reseal when the existing protection is actually failing.
If your driveway is beyond sealing and needs resurfacing or full replacement, use the Concrete Resurfacing Calculator, the Concrete Driveway Cost Calculator, and the Concrete Pour Cost Calculator to plan the scope and cost of the work.
🔧 Calculate Your Sealer Quantity
Enter your driveway dimensions and the Sealer Calculator returns exactly how many gallons you need – no guesswork, no waste.
Use the Sealer Calculator →🎯 Key Takeaways
-
>Wait at least 28 days after pouring new concrete before applying a standard driveway sealer
>Late spring through early fall is the best time to seal a concrete driveway in most US regions
>Apply sealer only when air and surface temperatures are between 50 and 85 degrees F
>No rain within 24 hours before or after sealing
>Overnight temps must stay above 50 F for the first 24 hours after application
>Penetrating silane-siloxane sealers last 5 to 10 years and are best for freeze-thaw climates
>Film-forming acrylic sealers add visible sheen but need reapplication every 2 to 3 years
>Two thin coats always outperform one heavy coat
>Allow 24 hours before foot traffic, 48 to 72 hours before vehicles
>Use the water bead test to check whether your driveway needs resealing
>Repair cracks and clean oil stains before applying any sealer
>Do not apply new sealer over a failing old coat without stripping first
Frequently Asked Questions
🛠 Related Calculators
-
>→ Concrete Sealer Calculator – Gallons of sealer needed for your exact driveway size
>→ Concrete Driveway Calculator – Volume and material estimate for a new driveway pour
>→ Concrete Cost Calculator – Total material and labor cost estimate
>→ Concrete Driveway Cost Calculator – Full replacement cost by size and region
>→ Concrete Resurfacing Calculator – Resurfacer coverage for worn or cracked driveways
>→ Concrete Thickness Calculator – Confirm proper slab depth for your driveway use
>→ Concrete Yardage Calculator – Cubic yards needed for any driveway dimension
>→ Concrete Walkway Calculator – Material estimate for attached walkways
>→ Concrete Apron Calculator – Volume for driveway apron sections
>→ Concrete Sidewalk Calculator – Estimate adjacent sidewalk sections
>→ Concrete Pour Cost Calculator – Price a replacement or repair pour
>→ Concrete Project Estimator – Full budget estimate for any concrete project
📚 Related Guides
-
>→ How to Pour a Concrete Driveway – Full pour guide from base prep to finish
>→ Concrete Curing and Drying Time Guide – The full 28-day curing process explained
>→ When Can You Drive on Concrete – Foot and vehicle traffic timelines
>→ Best Time to Pour Concrete – Seasonal and weather planning for a new driveway
>→ Pouring Concrete in Hot Weather – How heat affects fresh concrete and new sealers
>→ Pouring Concrete in the Rain – Why wet conditions damage concrete surfaces
>→ Concrete Temperature Limits – Safe working temperature ranges for concrete
>→ Why Is My Concrete Cracking – Causes of driveway cracks before you reseal
>→ How Thick Should a Concrete Driveway Be – Thickness recommendations for residential use
>→ Concrete vs. Asphalt Driveways – Full material comparison for homeowners