Pipe Flow Rate Chart 2026 – GPM by Size & Velocity
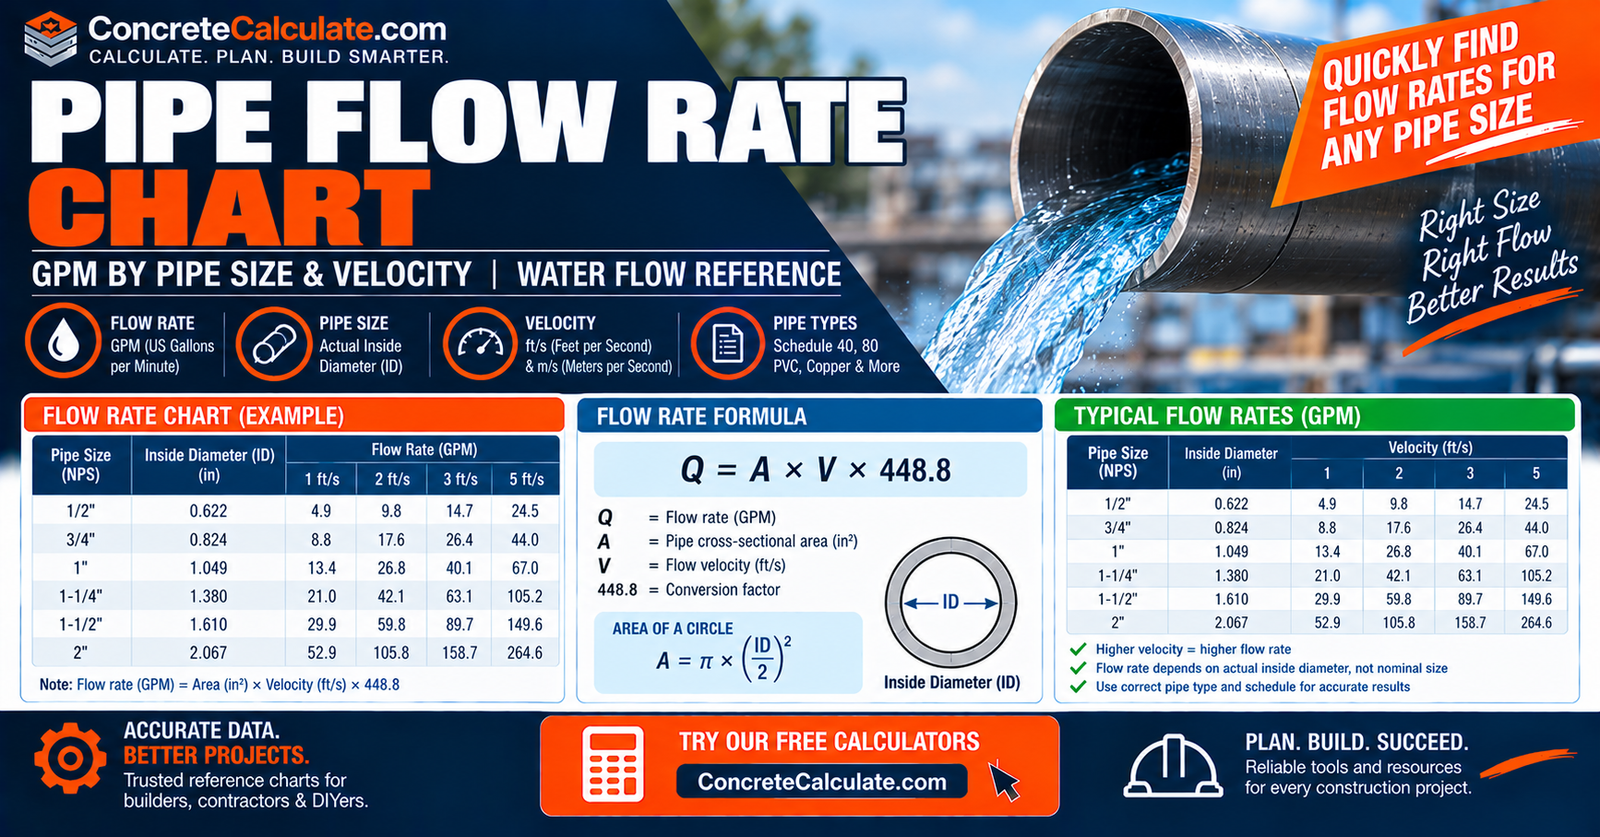
Pipe Flow Rate Chart
GPM by Size & Velocity
Water flow in gallons per minute by actual inside diameter and selected velocity for Schedule 40, Schedule 80, PVC, and copper pipe, with friction loss and pipe sizing guidance.
 Reviewed by Muhammad Ramzan Babar, PhD Researcher (Plasma Physics) & Calculator Developer, View Profile
A pipe size does not have one fixed GPM capacity
A 2-inch pipe can carry very different flow depending on the velocity, available pressure, pipe length, fittings, and allowable friction loss. This chart shows water flow rate corresponding to selected velocities using actual inside diameter, not nominal pipe size, based on the Pipe Inside Diameter Chart dimensions.
Water Flow Rate by Pipe Size and Velocity
Calculated GPM at four common velocities, using actual Schedule 40 inside diameter for each NPS.
| NPS (in) | Sch 40 ID (in) | 2 ft/s (GPM) | 4 ft/s (GPM) | 6 ft/s (GPM) | 8 ft/s (GPM) |
|---|---|---|---|---|---|
| 1/2 | 0.622 | 1.9 | 3.8 | 5.7 | 7.6 |
| 3/4 | 0.824 | 3.3 | 6.7 | 10.0 | 13.3 |
| 1 | 1.049 | 5.4 | 10.8 | 16.2 | 21.6 |
| 1-1/2 | 1.610 | 12.7 | 25.4 | 38.1 | 50.8 |
| 2 | 2.067 | 20.9 | 41.8 | 62.8 | 83.7 |
| 3 | 3.068 | 46.1 | 92.2 | 138.3 | 184.3 |
| 4 | 4.026 | 79.4 | 158.7 | 238.1 | 317.4 |
| 6 | 6.065 | 180.1 | 360.2 | 540.3 | 720.4 |
| 8 | 7.981 | 311.9 | 623.7 | 935.6 | 1247.4 |
Important Note
These are flow rates corresponding to selected water velocities, not universal maximum pipe capacities. Always check allowable friction loss, available pressure, service type, pipe material, and applicable code or design criteria before finalizing a pipe size.
What Is Pipe Flow Rate?
The volume of fluid passing through the pipe per unit time.
| Unit | Common Use |
|---|---|
| Gallons per minute (GPM) | Primary U.S. plumbing and water-system unit |
| Gallons per hour (GPH) | Lower flow-rate applications, irrigation |
| Cubic feet per minute (CFM) | Common for air and gas flow |
| Liters per minute (L/min) | Metric reference |
| Cubic meters per hour (m³/h) | Metric reference for larger systems |
Pipe Flow Rate vs Flow Velocity
An essential distinction that must appear before any GPM table makes sense.
| Term | Definition |
|---|---|
| Flow Rate (Q) | Volume of water passing a point per unit time |
| Velocity (V) | How fast the water travels through the pipe bore |
The relationship is Q = A × V. The same 4 ft/s velocity produces very different GPM in a 1-inch pipe versus a 6-inch pipe, because their internal flow areas differ greatly.
Pipe Flow Rate Formula
The core equation behind every value on this chart.
Formula
For circular pipe: A = πd²/4, and Q = AV. For U.S. pipe sizing in practical units: GPM ≈ 2.448 × d² × V, where d is inside diameter in inches and V is velocity in ft/s.
Example: NPS 2 Schedule 40 at 4 ft/s
Why Inside Diameter Controls Flow
Flow area scales with the square of diameter.
Since A = πd²/4, area increases with d², not d. That means small changes in actual inside diameter can materially change GPM at the same velocity, velocity at the same GPM, and pressure loss. See the Pipe Inside Diameter Chart for the full actual-bore reference by schedule.
Nominal Pipe Size vs Actual Flow Diameter
A critical warning before using the flow formula.
Do Not Use NPS Directly in the Flow Equation
NPS 2 Schedule 40 does not have a 2.000-in bore; its inside diameter is approximately 2.067 in. Hydraulic calculations should use the actual or reference ID rather than simply the nominal number.
Schedule 40 Pipe Flow Rate Chart
The main schedule table, satisfying most “pipe size GPM chart” searches.
| NPS (in) | Actual ID (in) | 2 ft/s | 4 ft/s | 6 ft/s | 8 ft/s |
|---|---|---|---|---|---|
| 1/2 | 0.622 | 1.9 | 3.8 | 5.7 | 7.6 |
| 3/4 | 0.824 | 3.3 | 6.7 | 10.0 | 13.3 |
| 1 | 1.049 | 5.4 | 10.8 | 16.2 | 21.6 |
| 1-1/4 | 1.380 | 9.3 | 18.7 | 28.0 | 37.3 |
| 1-1/2 | 1.610 | 12.7 | 25.4 | 38.1 | 50.8 |
| 2 | 2.067 | 20.9 | 41.8 | 62.8 | 83.7 |
| 2-1/2 | 2.469 | 29.9 | 59.7 | 89.5 | 119.4 |
| 3 | 3.068 | 46.1 | 92.2 | 138.3 | 184.3 |
| 4 | 4.026 | 79.4 | 158.7 | 238.1 | 317.4 |
| 6 | 6.065 | 180.1 | 360.2 | 540.3 | 720.4 |
| 8 | 7.981 | 311.9 | 623.7 | 935.6 | 1247.4 |
| 10 | 10.020 | 491.6 | 983.1 | 1474.7 | 1966.2 |
| 12 | 11.938 | 697.8 | 1395.5 | 2093.3 | 2791.0 |
Schedule 80 Pipe Flow Rate Chart
Schedule 80 normally has a smaller ID than Schedule 40 at the same NPS, so at the same velocity it carries fewer GPM.
| NPS (in) | Sch 80 ID (in) | 2 ft/s | 4 ft/s | 6 ft/s | 8 ft/s |
|---|---|---|---|---|---|
| 1/2 | 0.546 | 1.5 | 2.9 | 4.4 | 5.8 |
| 3/4 | 0.742 | 2.7 | 5.4 | 8.1 | 10.8 |
| 1 | 0.957 | 4.5 | 9.0 | 13.5 | 17.9 |
| 1-1/2 | 1.500 | 11.0 | 22.0 | 33.1 | 44.1 |
| 2 | 1.939 | 18.4 | 36.8 | 55.2 | 73.6 |
| 3 | 2.900 | 41.2 | 82.4 | 123.5 | 164.7 |
| 4 | 3.826 | 71.7 | 143.3 | 215.0 | 286.7 |
| 6 | 5.761 | 162.5 | 325.0 | 487.5 | 650.0 |
| 8 | 7.625 | 284.7 | 569.3 | 854.0 | 1138.6 |
For dimensional data beyond flow, see the Schedule 80 Pipe Chart and Pipe Inside Diameter Chart.
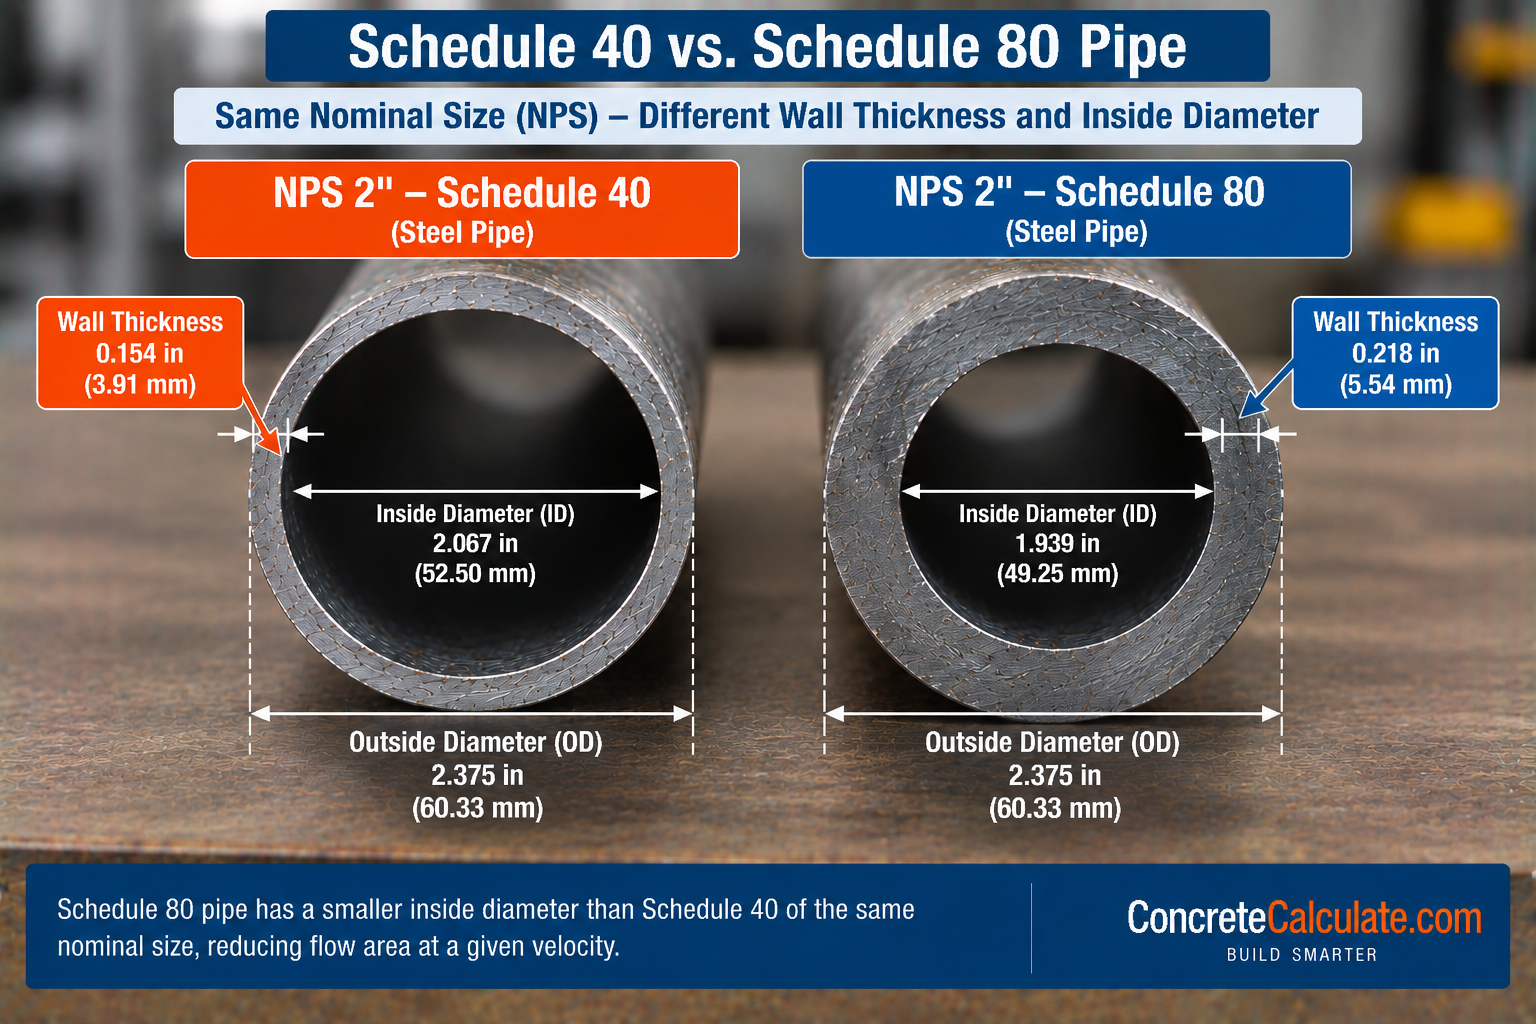
Schedule 40 vs Schedule 80 Flow Rate
Schedule itself does not directly control flow; it changes wall thickness, which changes ID.
| NPS (in) | Sch 40 ID | Sch 80 ID | Sch 40 GPM @ 4 fps | Sch 80 GPM @ 4 fps | Difference |
|---|---|---|---|---|---|
| 1 | 1.049 | 0.957 | 10.8 | 9.0 | 1.8 |
| 2 | 2.067 | 1.939 | 41.8 | 36.8 | 5.0 |
| 4 | 4.026 | 3.826 | 158.7 | 143.3 | 15.4 |
| 6 | 6.065 | 5.761 | 360.2 | 325.0 | 35.2 |
Pipe Diameter vs Flow Rate
Why diameter has such a large effect on flow.
At the same velocity, Q is proportional to d². So doubling the inside diameter yields approximately four times the flow at the same velocity, not twice. This nonlinear relationship is one of the most important concepts for pipe sizing decisions.
Water Velocity Chart
General interpretation of common design velocities, not universal safe or unsafe labels.
| Velocity | General Interpretation |
|---|---|
| 2 ft/s | Low to moderate water velocity |
| 4 ft/s | Common conservative design reference in smaller hydronic pipe |
| 6 ft/s | Higher general-service flow |
| 8 ft/s | High for many small or plumbing applications |
| 10+ ft/s | Application-specific; noise, erosion, and energy concerns increase |
ASHRAE’s pipe-design guidance gives service-dependent velocity ranges and states that accepted limits depend on noise, erosion, pumping cost, and application, not a single fixed number.
Recommended Water Velocity by Application, Why There Is No One Limit
An essential technical section for this chart’s credibility.
| Application | Typical Velocity Range |
|---|---|
| General water service | Roughly 4 to 10 ft/s |
| City/tap water | Roughly 2 to 7 ft/s |
| Pump suction / drain lines | Roughly 3 to 7 ft/s |
Key Message
Velocity limits are service-specific design criteria, not universal properties of pipe diameter. The correct limit depends on the application, material, and system.
Small-Pipe Velocity, Noise, and Erosion
The most commonly cited hydronic velocity guideline, explained with proper context.
ASHRAE and related hydronic design references commonly cite a velocity limit around 4 ft/s for piping 2 in. and smaller, primarily related to noise concerns, while noting that larger piping is often sized using an allowable friction loss instead, commonly around 4 ft of water per 100 ft. This is a widely used design practice rather than an absolute physical cutoff.
Other noise contributors beyond raw velocity include entrained air, sudden pressure drops, turbulence, valves and fittings, and cavitation. Water above 4 ft/s does not automatically cause noise in every system; the actual result depends on these additional factors.
Minimum Flow Velocity and Air Transport in Hydronic Piping
Velocity that is too low can also matter.
Hydronic design guidance commonly notes that roughly 1.5 to 2 ft/s or more helps carry entrained air toward air-separation devices in smaller piping. Air can begin separating from water below this range. This demonstrates why bigger pipe is not always automatically better; oversized piping can produce velocities too low to effectively transport entrained air.
Copper Pipe Water Flow Rate Chart
A material-specific supporting section using actual copper tube inside diameters.
| Copper Size (in) | Type | Actual ID (in) | 2 ft/s (GPM) | 5 ft/s (GPM) | 8 ft/s (GPM) |
|---|---|---|---|---|---|
| 1/2 | K | 0.527 | 1.4 | 3.4 | 5.4 |
| 1/2 | L | 0.545 | 1.5 | 3.6 | 5.8 |
| 1/2 | M | 0.569 | 1.6 | 4.0 | 6.3 |
| 3/4 | L | 0.785 | 3.0 | 7.5 | 12.1 |
| 1 | L | 1.025 | 5.1 | 12.9 | 20.6 |
Copper Development Association guidance generally recommends water velocity should not exceed roughly 5 to 8 ft/s in plumbing tube, with the lower part of the range applying to smaller sizes, because excessive velocity can contribute to erosion-corrosion and noise. For complete copper dimensional data, see the Copper Pipe Size Chart.
Hot-Water vs Cold-Water Velocity
Traditional copper plumbing design guidance, not a universal rule for every material.
| Service | Traditional Copper Guidance |
|---|---|
| Hot water | Approximately 5 ft/s maximum |
| Cold water | Approximately 8 ft/s maximum |
This is Copper Development Association traditional design guidance as reported in ASHRAE references. Do not extrapolate these specific numbers to every material or system; other application-specific recommendations also exist.
PVC Pipe Flow Rate Chart
Using actual PVC inside diameter, with material-appropriate velocity context.
| PVC Size (in) | Schedule | Actual ID (in) | 3 ft/s (GPM) | 5 ft/s (GPM) |
|---|---|---|---|---|
| 1/2 | 40 | 0.622 | 2.9 | 4.7 |
| 1 | 40 | 1.049 | 8.1 | 13.5 |
| 2 | 40 | 2.067 | 31.4 | 52.3 |
| 4 | 40 | 4.026 | 119.0 | 198.4 |
Thermoplastic piping systems are commonly limited to around 5 ft/s under many operating conditions, though higher velocities can sometimes be used where pump and valve behavior and surge are properly controlled; do not present 8 ft/s as automatically recommended for PVC without checking the applicable design standard. For complete PVC dimensional data, see the PVC Pipe Size Chart.
Steel vs Copper vs PVC Flow Behavior
An important concept that prevents a misleading material comparison.
At the same actual inside diameter and velocity, Q = AV, so volumetric flow is identical regardless of pipe material. Material primarily changes which actual inside diameters are available at a given nominal size, pipe roughness, allowable velocity or design guidance, friction loss, and pressure or temperature limits. This means a statement like “PVC flows more than steel” is misleading; it is the diameter and velocity, not the material itself, that determines flow at a given point.
Pipe Flow Rate vs Available Pressure
A major search-intent distinction that separates this chart from a simple online calculator.
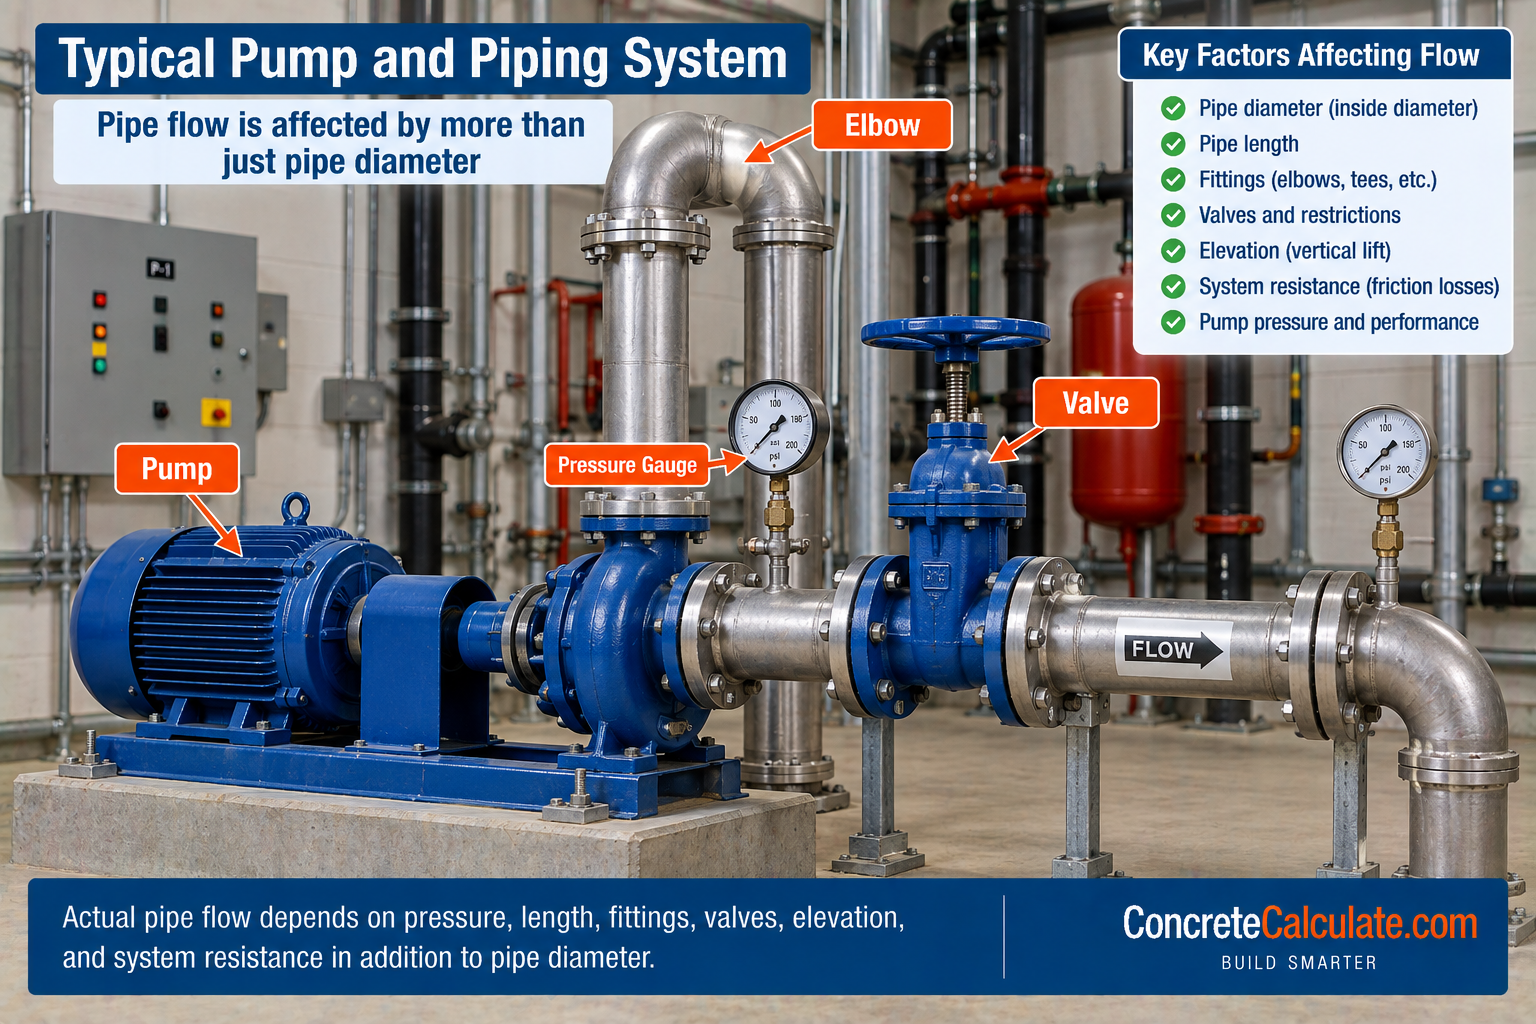
A pipe does not produce a particular flow just because its diameter is known. Available flow also depends on upstream pressure, downstream pressure, elevation, pipe length, fittings, valves, and pipe roughness. Pipe diameter plus pressure does not translate directly to GPM without knowing the system resistance.
Flow Rate vs Pressure Drop
As flow increases, so does the resistance the system must overcome.
As flow increases, velocity increases, friction loss increases, and the required pump pressure or head increases. Pipe sizing is therefore usually an iterative balance among flow rate, velocity, diameter, and friction head loss. Many hydronic systems are preliminarily sized using friction rates in the approximate range of 0.75 to 4 ft of water per 100 ft of straight pipe.
Pipe Friction Loss per 100 ft
Friction loss depends on pipe material, actual ID, and roughness, not one universal table.
| Pipe Size (in) | GPM | Velocity (ft/s) | Friction Loss (ft/100 ft), C=140 |
|---|---|---|---|
| 4 | 50 | 1.2 | 0.18 |
| 4 | 100 | 2.5 | 0.64 |
Hydronic system design commonly uses roughly 1 to 4 ft of water per 100 ft as a general friction-rate design range, with about 2.5 ft/100 ft near the middle of that range. Actual friction loss depends on the specific pipe material, actual inside diameter, and roughness condition, so this is a representative example, not a universal chart for every pipe and fluid.
Hazen-Williams Equation and C Factor
The most commonly used water-piping friction formula in U.S. design practice.
Formula
h(f) [ft per 100 ft] = 0.2083 × (100/C)¹·⁵⁵² × Q¹·⁵⁵² ÷ d⁴·⁶⁶⁵⁵, where Q is flow in GPM, d is inside diameter in inches, and C is the Hazen-Williams roughness coefficient.
A higher C factor indicates smoother hydraulic behavior and lower predicted friction for the same flow and diameter. C factors depend on material, age, and internal condition; common design values range roughly from 100 to 150 depending on material and service. The Hazen-Williams equation is empirical and primarily appropriate for water-service calculations, not arbitrary fluids.
Darcy-Weisbach vs Hazen-Williams
Two friction-loss frameworks with different scope.
| Method | Scope |
|---|---|
| Darcy-Weisbach | More general physical friction framework, applicable to different fluids when the needed fluid, roughness, and Reynolds number data are handled correctly |
| Hazen-Williams | Empirical water-piping method, simpler but limited to water-service calculations |
Darcy-Weisbach is generally considered the more accurate model, while Hazen-Williams is a commonly used, simpler empirical alternative specifically for water.
How Pipe Length Affects Flow
Longer piping means greater frictional resistance for the same flow.
Two identical 1-inch pipes supplied at the same pressure can deliver different actual flows if one is 20 ft long and the other is 300 ft long, because the longer pipe accumulates more total friction loss. This directly demonstrates why “1-inch pipe equals X GPM” is an incomplete statement without knowing the length and available pressure.
Fittings, Valves, and Equivalent Length
Fittings add resistance beyond straight pipe.
Elbows, tees, valves, and other fittings add hydraulic resistance beyond straight-pipe friction. Plumbing code references provide equivalent-length values for fittings; for example, published tables assign substantially greater equivalent length to branch flow through a tee than to straight-through tee flow. The design workflow adds actual straight pipe length to the total equivalent length of all fittings before calculating total friction loss.
Pipe Flow Area Chart
Useful beyond standardized NPS pipe, for any actual bore diameter.
| Actual ID (in) | Flow Area (in²) | 2 ft/s (GPM) | 4 ft/s (GPM) | 6 ft/s (GPM) |
|---|---|---|---|---|
| 0.622 | 0.304 | 1.9 | 3.8 | 5.7 |
| 1.049 | 0.864 | 5.4 | 10.8 | 16.2 |
| 2.067 | 3.356 | 20.9 | 41.8 | 62.8 |
| 4.026 | 12.73 | 79.4 | 158.7 | 238.1 |
Flow area uses A = πd²/4, where d is the actual inside diameter in inches.
GPM-to-Velocity Chart
A reverse lookup for a required flow rate: “I need 50 GPM, how fast will the water move in this pipe?”
Formula
V = Q ÷ (2.448 × d²)
| Pipe ID (in) | 5 GPM | 10 GPM | 20 GPM | 50 GPM | 100 GPM |
|---|---|---|---|---|---|
| 0.622 | 5.3 ft/s | 10.6 ft/s | 21.1 ft/s | 52.8 ft/s | 105.6 ft/s |
| 1.049 | 1.9 ft/s | 3.7 ft/s | 7.4 ft/s | 18.6 ft/s | 37.1 ft/s |
| 2.067 | 0.5 ft/s | 1.0 ft/s | 1.9 ft/s | 4.8 ft/s | 9.6 ft/s |
| 4.026 | 0.1 ft/s | 0.3 ft/s | 0.5 ft/s | 1.3 ft/s | 2.5 ft/s |
GPM, L/min, and m³/h Conversions
Metric equivalents for a primarily U.S.-first reference.
Conversion Factors
1 US gpm ≈ 3.7854 L/min. 1 US gpm ≈ 0.2271 m³/h.
Domestic Plumbing Water-Supply Flow vs Pipe Capacity
A distinction that matters for homeowner and residential-plumbing traffic.
Plumbing pipe sizing is based on more than a velocity chart. It also considers fixture demand, available supply pressure, elevation, developed length, minimum fixture pressure, and fittings. The International Plumbing Code requires water-distribution sizing to maintain required flow and pressure under peak-demand conditions, not simply a nominal velocity target.
| Fixture | Typical Minimum Flow (GPM) |
|---|---|
| Residential shower | 2.5 |
| Hose bibb | 5.0 |
| Residential dishwasher | 2.75 |
Simultaneous design flow for a house is not simply the arithmetic sum of every fixture’s rated flow; plumbing codes use demand-factor methods for this reason. Do not size an entire house solely from the GPM-by-velocity table on this page.
Gravity Pipe Flow vs Full Pressurized Pipe Flow
An important scope limitation for this chart.
This Chart Covers Full, Pressurized Water Pipe Only
It does not cover partially full sewer, storm drain, or open-channel pipe. Gravity flow depends on slope, depth of flow, roughness, and pipe geometry, and typically uses different hydraulic methods such as Manning-type analysis rather than the Q = AV pressurized-pipe approach used throughout this page.
How to Choose Pipe Size for a Required Flow
The page’s main decision framework.
Pipe Sizing Workflow
Common Pipe Flow Rate Chart Mistakes
Treating GPM as fixed by nominal pipe size
Flow depends on actual ID and velocity, not the nominal label alone.
Calling a flow value the pipe’s universal maximum capacity
Chart values correspond to selected velocities, not one fixed capacity.
Using NPS instead of actual ID
NPS 2 pipe has a bore of about 2.067 in, not 2.000 in.
Ignoring schedule
Schedule changes ID, which changes flow area at the same velocity.
Assuming Schedule 40 and 80 have the same flow area
Schedule 80’s smaller ID reduces flow area for the same NPS.
Ignoring velocity
The same pipe can carry very different GPM at different velocities.
Ignoring pressure loss
Friction loss must be checked against available pressure or head.
Assuming more pressure always means proportionally more flow
Flow depends on system resistance, not pressure alone.
Ignoring pipe length
Longer pipe means more total friction loss for the same flow.
Ignoring elbows, tees, and valves
Fittings add resistance beyond straight-pipe friction loss.
Using one velocity limit for every material
Copper, PVC, and steel have different design velocity guidance.
Assuming 4 ft/s is a universal maximum
It is a common hydronic guideline for small pipe, not a physical limit for every system.
Assuming 8 ft/s is always acceptable
Acceptable velocity depends on application, material, and service.
Applying copper velocity guidance to every material
PVC and steel have their own design velocity considerations.
Ignoring hot-vs-cold-water considerations
Traditional copper guidance differs between hot and cold service.
Using Hazen-Williams for arbitrary fluids
The equation is empirical and intended primarily for water.
Ignoring pipe roughness or age
The C factor changes with material condition and affects friction loss.
Using OD instead of ID in flow calculations
Flow area is based on the internal bore, not the outside diameter.
Confusing GPM with velocity
Flow rate and velocity are related but distinct quantities.
Sizing domestic plumbing only from the GPM chart
Residential systems require fixture demand and pressure calculations too.
Using a pressure-flow chart for gravity sewer
Gravity pipe requires slope-based analysis, not the pressurized Q = AV method.
Forgetting that corrosion or scale can reduce effective bore
Older pipe may have a smaller effective ID than the nominal chart value.
Pipe Flow Rate Chart Limitations
Read Before Using for System Design
The main chart represents water flow corresponding to specified velocities; it does not establish a universal maximum flow. Actual inside diameter, not nominal size, governs flow area, and schedule changes the ID. Friction increases with flow rate, and pipe length and fittings both matter. Available pressure and head must be checked against total friction loss. Fluid properties matter for any fluid other than water. Material and service velocity guidance differs by application. Old or scaled pipe may have different effective roughness and bore than nominal chart values. Plumbing systems require demand and pressure calculations beyond a velocity chart. Gravity-flow pipe requires a different analysis method entirely. Fire-protection, process, medical-gas, and other specialized systems should follow their governing design standards rather than this general water-flow reference.
Frequently Asked Questions
Download Pipe Flow Rate Chart PDF
Save or print this reference including the Schedule 40 and Schedule 80 GPM tables, velocity guidance, friction loss context, and the pipe sizing decision workflow.